Categories
fiction problems of scale topic modeling

Do topic models warp time?

Recently, historians have been trying to understand cultural change by measuring the “distances” that separate texts, songs, or other cultural artifacts. Where distances are large, they infer that change has been rapid. There are many ways to define distance, but one common strategy begins by topic modeling the evidence. Each novel (or song, or political speech) can be represented as a distribution across topics in the model. Then researchers estimate the pace of change by measuring distances between topic distributions.

In 2015, Mauch et al. used this strategy to measure the pace of change in popular music—arguing, for instance, that changes linked to hip-hop were more dramatic than the British invasion. Last year, Barron et al. used a similar strategy to measure the influence of speakers in French Revolutionary debate.

I don’t think topic modeling causes problems in either of the papers I just mentioned. But these methods are so useful that they’re likely to be widely imitated, and I do want to warn interested people about a couple of pitfalls I’ve encountered along the road.

One reason for skepticism will immediately occur to humanists: are human perceptions about difference even roughly proportional to the “distances” between topic distributions? In one case study I examined, the answer turned out to be “yes,” but there are caveats attached. Read the paper if you’re curious.

In this blog post, I’ll explore a simpler and weirder problem. Unless we’re careful about the way we measure “distance,” topic models can warp time. Time may seem to pass more slowly toward the edges of a long topic model, and more rapidly toward its center.

For instance, suppose we want to understand the pace of change in fiction between 1885 and 1984. To make sure that there is exactly the same amount of evidence in each decade, we might randomly select 750 works in each decade, and reduce each work to 10,000 randomly sampled words. We topic-model this corpus. Now, suppose we measure change across every year in the timeline by calculating the average cosine distance between the two previous years and the next two years. So, for instance, we measure change across the year 1911 by taking each work published in 1909 or 1910, and comparing its topic proportions (individually) to every work published in 1912 or 1913. Then we’ll calculate the average of all those distances. The (real) results of this experiment are shown below.

firstdiscovery

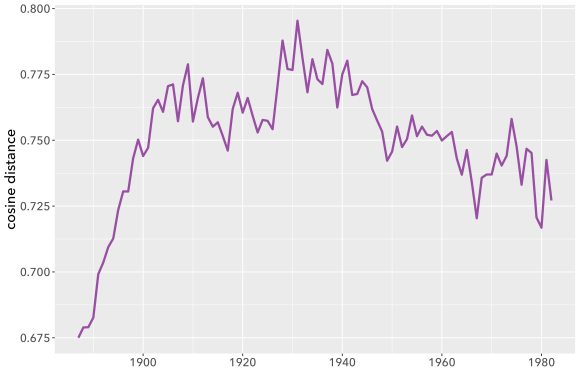
Perhaps we’re excited to discover that the pace of change in fiction peaks around 1930, and declines later in the twentieth century. It fits a theory we have about modernism! Wanting to discover whether the decline continues all the way to the present, we add 25 years more evidence, and create a new topic model covering the century from 1910 to 2009. Then we measure change, once again, by measuring distances between topic distributions. Now we can plot the pace of change measured in two different models. Where they overlap, the two models are covering exactly the same works of fiction. The only difference is that one covers a century (1885-1984) centered at 1935, and the other a century (1910-2009) centered at 1960.

seconddiscovery

But the two models provide significantly different pictures of the period where they overlap. 1978, which was a period of relatively slow change in the first model, is now a peak of rapid change. On the other hand, 1920, which was a point of relatively rapid change, is now a trough of sluggishness.

Puzzled by this sort of evidence, I discussed this problem with Laure Thompson and David Mimno at Cornell, who suggested that I should run a whole series of models using a moving window on the same underlying evidence. So I slid a 100-year window across the two centuries from 1810 to 2009 in five 25-year steps. The results are shown below; I’ve smoothed the curves a little to make the pattern easier to perceive.

timewarp

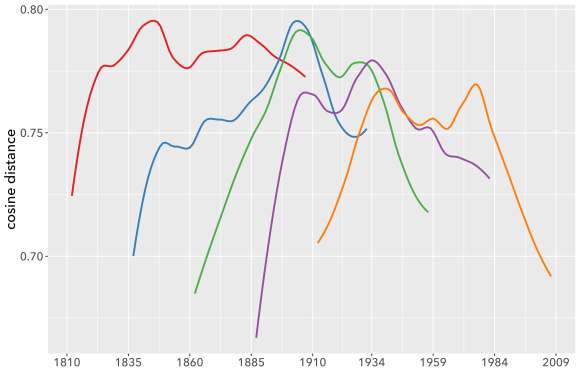
The models don’t agree with each other well at all. You may also notice that all these curves are loosely n-shaped; they peak at the middle and decline toward the edges (although sometimes to an uneven extent). That’s why 1920 showed rapid change in a model centered at 1935, but became a trough of sloth in one centered at 1960. To make the pattern clearer we can directly superimpose all five models and plot them on an x-axis using date relative to the model’s timeline (instead of absolute date).

rainbow

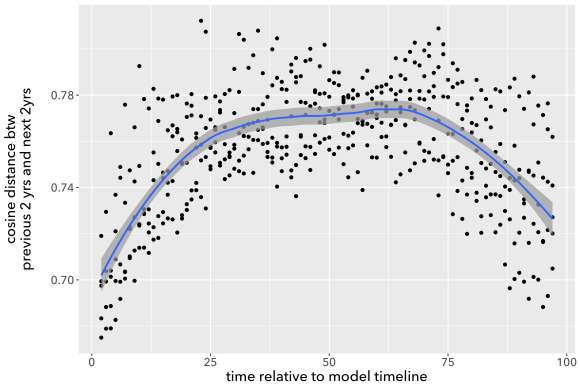
The pattern is clear: if you measure the pace of change by comparing documents individually, time is going to seem to move faster near the center of the model. I don’t entirely understand why this happens, but I suspect the problem is that topic diversity tends to be higher toward the center of a long timeline. When the modeling process is dividing topics, phenomena at the edges of the timeline may fall just below the threshold to form a distinct topic, because they’re more sparsely represented in the corpus (just by virtue of being near an edge). So phenomena at the center will tend to be described with finer resolution, and distances between pairs of documents will tend to be greater there. (In our conversation about the problem, David Mimno ran a generative simulation that produced loosely similar behavior.)

To confirm that this is the problem, I’ve also measured the average cosine distance, and Kullback-Leibler divergence, between pairs of documents in the same year. You get the same n-shaped pattern seen above. In other words, the problem has nothing to do with rates of change as such; it’s just that all distances tend to be larger toward the center of a topic model than at its edges. The pattern is less clearly n-shaped with KL divergence than with cosine distance, but I’ve seen some evidence that it distorts KL divergence as well.

But don’t panic. First, I doubt this is a problem with topic models that cover less than a decade or two. On a sufficiently short timeline, there may be no systematic difference between topics represented at the center and at the edges. Also, this pitfall is easy to avoid if we’re cautious about the way we measure distance. For instance, in the example above I measured cosine distance between individual pairs of documents across a 5-year period, and then averaged all the distances to create an “average pace of change.” Mathematically, that way of averaging things is slighly sketchy, for reasons Xanda Schofield explained on Twitter:

xanda

The mathematics of cosine distance tend to work better if you average the documents first, and then measure the cosine between the averages (or “centroids”). If you take that approach—producing yearly centroids and comparing the centroids—the five overlapping models actually agree with each other very well.

timeunwarped

Calculating centroids factors out the n-shaped pattern governing average distances between individual books, and focuses on the (smaller) component of distance that is actually year-to-year change. Lines produced this way agree very closely, even about individual years where change seems to accelerate. As substantive literary history, I would take this evidence with a grain of salt: the corpus I’m using is small enough that the apparent peaks could well be produced by accidents of sampling. But the math itself is working.

I’m slightly more confident about the overall decline in the pace of change from the nineteenth century to the twenty-first. Although it doesn’t look huge on this graph, that pattern is statistically quite strong. But I would want to look harder before venturing a literary interpretation. For instance, is this pattern specific to fiction, or does it reflect a broadly shared deceleration in underlying rates of linguistic change? As I argued in a recent paper, supervised models may be better than raw distance measures at answering that culturally-specific question.

But I’m wandering from the topic of this post. The key observation I wanted to share is just that topic models produce a kind of curved space when applied to long timelines; if you’re measuring distances between individual topic distributions, it may not be safe to assume that your yardstick means the same thing at every point in time. This is not a reason for despair: there are lots of good ways to address the distortion. But it’s the kind of thing researchers will want to be aware of.


Categories
machine learning problems of scale

A more intimate scale of distant reading.

How big, exactly, does a collection of literary texts have to be before it makes sense to say we’re doing “distant reading”?

It’s a question people often ask, and a question that distant readers often wriggle out of answering, for good reason. The answer is not determined by the technical limits of any algorithm. It depends, rather, on the size of the blind spots in our knowledge of the literary past — and it’s part of the definition of a blind spot that we don’t already know how big it is. How far do you have to back up before you start seeing patterns that were invisible at your ordinary scale of reading? That’s how big your collection needs to be.

But from watching trends over the last couple of years, I am beginning to get the sense that the threshold for distant reading is turning out to be a bit lower than many people are currently assuming (and lower than I assumed myself in the past). To cut to the chase: it’s probably dozens or scores of books, rather than thousands.

I think there are several reasons why we all got a different impression. One is that Franco Moretti originally advertised distant reading as a continuation of 1990s canon-expansion: the whole point, presumably, was to get beyond the canon and recover a vast “slaughterhouse of literature.” That’s still one part of the project — and it leads to a lot of debate about the difficulty of recovering that slaughterhouse. But sixteen years later, it is becoming clear that new methods also allow us to do a whole lot of things that weren’t envisioned in Moretti’s original manifesto. Even if we restricted our collections to explicitly canonical works, we would still be able to tease out trends that are too long, or family resemblances that are too loose, to be described well in existing histories.

The size of the collection required depends on the question you’re posing. Unsupervised algorithms, like those used for topic modeling, are easy to package as tools: just pour in the books, and out come some topics. But since they’re not designed to answer specific questions, these approaches tend to be most useful for exploratory problems, at large scales of inquiry. (One recent project by Emily Barry, for instance, uses 22,000 Supreme Court cases.)

By contrast, a lot of recent work in distant reading has used supervised models to zero in on narrowly specified historical questions about genre or form. This approach can tell you things you didn’t already know at a smaller scale of inquiry. In “Literary Pattern Recognition,” Hoyt Long and Richard So start by gathering 400 poems in the haiku tradition. In a recent essay on genre I talk about several hundred works of detective fiction, but also ten hardboiled detective novels, and seven Newgate novels.


Figure5Generational
Predictive accuracy for several genres of roughly generational size, plotted relative to a curve that indicates accuracy for a random sample of detective fiction drawn from the whole period 1829-1989. The shaded ribbon covers 90% of models for a given number of examples.

Admittedly, seven is on the low side. I wouldn’t put a lot of faith in any individual dot above. But I do think we can learn something by looking at five subgenres that each contain 7-21 volumes. (In the graph above we learn, for instance, that focused “generational” genres aren’t lexically more coherent than a sample drawn from the whole 160 years of detective fiction — because the longer tradition is remarkably coherent, and pretty easy to recognize, even when you downsample it to ten or twenty volumes.)

I’d like to pitch this reduction of scale as encouraging news. Grad students and assistant professors don’t have to build million-volume collections before they can start exploring new methods. And literary scholars can practice distant reading without feeling they need to buy into any cyclopean ethic of “big data.” (I’m not sure that ethic exists, except as a vaguely-sketched straw man. But if it did exist, you wouldn’t need to buy into it.)

Computational methods themselves won’t even be necessary for all of this work. For some questions, standard social-scientific content analysis (aka reading texts and characterizing them according to an agreed-upon scheme) is a better way to proceed. In fact, if you look back at “The Slaughterhouse of Literature,” that’s what Moretti did with “about twenty” detective stories (212). Shawna Ross recently did something similar, looking at the representation of women’s scholarship at MLA#16 by reading and characterizing 792 tweets.

Humanists still have a lot to learn about social-scientific methods, as Tanya Clement has recently pointed out. (Inter-rater reliability, anyone?) And I think content analysis will run into some limits as we stretch the timelines of our studies: as you try to cover centuries of social change, it gets hard to frame a predefined coding scheme that’s appropriate for everything on the timeline. Computational models have some advantages at that scale, because they can be relatively flexible. Plus, we actually do want to reach beyond the canon.

But my point is simply that “distant reading” doesn’t prescribe a single scale of analysis. There’s a smooth ramp that leads from describing seven books, to characterizing a score or so (still by hand, but in a more systematic way), to statistical reflection on the uncertainty and variation in your evidence, to text mining and computational modeling (which might cover seven books or seven hundred). Proceed only as far as you find useful for a given question.

Categories
interpretive theory methodology problems of scale undigitized humanities

The imaginary conflicts disciplines create.

One thing I’ve never understood about humanities disciplines is our insistence on staging methodology as ethical struggle. I don’t think humanists are uniquely guilty here; at bottom, it’s probably the institution of disciplinarity itself that does it. But the normative tone of methodological conversation is particularly odd in the humanities, because we have a reputation for embracing multiple perspectives. And yet, where research methods are concerned, we actually seem to find that very hard.

It never seems adequate to say “hey, look through the lens of this method for a sec — you might see something new.” Instead, critics practicing historicism feel compelled to justify their approach by showing that close reading is the crypto-theological preserve of literary mandarins. Arguments for close reading, in turn, feel compelled to claim that distant reading is a slippery slope to takeover by the social sciences — aka, a technocratic boot stomping on the individual face forever. Or, if we do admit that multiple perspectives have value, we often feel compelled to prescribe some particular balance between them.

Imagine if biologists and sociologists went at each other in the same way.

“It’s absurd to study individual bodies, when human beings are social animals!”

“Your obsession with large social phenomena is a slippery slope — if we listened to you, we would eventually forget about the amazing complexity of individual cells!”

“Both of your methods are regrettably limited. What we need, today, is research that constantly tempers its critique of institutions with close analysis of mitochondria.”

As soon as we back up and think about the relation between disciplines, it becomes obvious that there’s a spectrum of mutually complementary approaches, and different points on the spectrum (or different combinations of points) can be valid for different problems.

So why can’t we see this when we’re discussing the possible range of methods within a discipline? Why do we feel compelled to pretend that different approaches are locked in zero-sum struggle — or that there is a single correct way of balancing them — or that importing methods from one discipline to another raises a grave ethical quandary?

It’s true that disciplines are finite, and space in the major is limited. But a debate about “what will fit in the major” is not the same thing as ideology critique or civilizational struggle. It’s not even, necessarily, a substantive methodological debate that needs to be resolved.

Categories
problems of scale

Against (talking about) “big data.”

Is big data the future of X? Yes, absolutely, for all X. No, forget about big data: small data is the real revolution! No, wait. Forget about big and small — what matters is long data.

800px-Looking_Up_at_Empire_State_BuildingConversation about “big data” has become a hilarious game of buzzword bingo, aggravated by one of the great strengths of social media — the way conversations in one industry or field seep into another. I’ve seen humanists retweet an article by a data scientist criticizing “big data,” only to discover a week later that their author defines “small data” as anything less than a terabyte. Since the projects that humanists would call “big” usually involve less than a tenth of a terabyte, it turns out that our brutal gigantism is actually artisanal and twee.

The discussion is incoherent, but human beings like discussion, and are reluctant to abandon a lively one just because it makes no sense. One popular way to save this conversation is to propose that the “big” in “big data” may be a purely relative term. It’s “whatever is big for you.” In other words, perhaps we’re discussing a generalized expansion of scale, across all scales? For Google, “big data” might mean moving from petabytes to exabytes. For a biologist, it might mean moving from gigabytes to terabytes. For a humanist, it might mean any use of quantitative methods at all.

This solution is rhetorically appealing, but still incoherent. The problem isn’t just that we’re talking about different sizes of data. It’s that the concept of “big data” conflates trends located in different social contexts, that raise fundamentally different questions.

To sort things out a little, let me name a few of the different contexts involved:

1) Big IT companies are simply confronting new logistical problems. E.g., if you’re wrangling a petabyte or more, it no longer makes sense to move the data around. Instead you want to clone your algorithm and send it to the (various) machines where the data already lives.

2) But this technical sense of the word shades imperceptibly into another sense where it’s really a name for new business opportunities. The fact that commerce is now digital means that companies can get a new stream of information about consumers. This sort of market research may or may not actually require managing “big data” in sense (1). A widely-cited argument from Microsoft Research suggests that most applications of this kind involve less than 14GB and could fit into memory on a single machine.

3) Interest in these business opportunities has raised the profile of a loosely-defined field called “data science,” which might include machine learning, data mining, information retrieval, statistics, and software engineering, as well as aspects of social-scientific and humanistic analysis. When The New York Times writes that a Yale researcher has “used Big Data” to reveal X — with creepy capitalization — they’re not usually making a claim about the size of the dataset at all. They mean that some combination of tools from this toolkit was involved.

4) Social media produces new opportunities not only for corporations, but for social scientists, who now have access to a huge dataset of interactions between real, live, dubiously representative people. When academics talk about “big data,” they’re most often discussing the promise and peril of this research. Jean Burgess and Axel Bruns have focused explicitly on the challenges of research using Twitter, as have Melissa Terras, Shirley Williams, and Claire Warwick.

5) Some prominent voices (e.g., the editor-in-chief of Wired) have argued that the availability of data makes explicit theory-building less important. Most academics I know are at least slightly skeptical. The best case for this thesis might be something like machine translation, where a brute-force approach based on a big corpus of examples turns out to be more efficient than a painstakingly crafted linguistic model. Clement Levallois, Stephanie Steinmetz, and Paul Wouters have reflected thoughtfully on the implications for social science.

6) In a development that may or may not have anything to do with senses 1-5, quantitative methods have started to seem less ridiculous to humanists. Quantitative research has a long history in the humanities, from ARTFL to the Annales school to nineteenth-century philology. But it has never occupied center stage — and still doesn’t, although it is now considered worthy of debate. Since humanists usually still work with small numbers of examples, any study with n > 50 is in danger of being described as an example of “big data.”

These are six profoundly different issues. I don’t mean to deny that they’re connected: contemporaneous trends are almost always connected somehow. The emergence of the Internet is probably a causal factor in everything described above.

But we’re still talking about developments that are very different — not just because they involve different scales, but because they’re grounded in different institutions and ideas. I can understand why journalists are tempted to lump all six together with a buzzword: buzz is something that journalists can’t afford to ignore. But academics should resist taking the bait: you can’t make a cogent argument about a buzzword.

I think it’s particularly a mistake to assume that interest in scale is associated with optimism about the value of quantitative analysis. That seems to be the assumption driving a lot of debate about this buzzword, but it doesn’t have to be true at all.

To take an example close to my heart: the reason I don’t try to mine small datasets is that I’m actually very skeptical about the humanistic value of quantification. Until we get full-blown AI, I doubt that computers will add much to our interpretation of one, or five, or twenty texts. In the context of obsession with the boosterism surrounding “big data,” people tend to understand this hesitation as a devaluation of something called (strangely) “small data.” But the issue is really the reverse: the interpretive problems in individual works are interesting and difficult, and I don’t think digital technology provides enough leverage to crack them. In the humanities, numbers help mainly with simple problems that happen to be too large to fit in human memory.

To make a long story short: “big data” is not an imprecise-but-necessary term. It’s a journalistic buzzword with a genuinely harmful kind of incoherence. I personally avoid it, and I think even journalists should proceed with caution.