Categories
19c 20c cultural analytics deep learning fiction plot plot

Can language models predict the next twist in a story?

While distant reading has taught us a lot about the history of fiction, it hasn’t done much yet to explain why we keep turning pages.

“Suspense” is the word we use to explain that impulse. But what is suspense? Does it require actual anxiety, or just uncertainty about what happens next? If suspense depends on not knowing what will happen, how can we enjoy re-reading familiar books? (Smuts 2009) And why do we enjoy being surprised? (Tobin 2018)

Beyond these big theoretical puzzles, there are historical questions scholars might like to ask about the way authors use chapter breaks to structure narrative revelation (Dames 2023, 219-38).

Right now, distant reading can’t fully answer any of these questions. When we want to measure surprise or novelty, for instance, we typically measure change in the verbal texture of a story from beginning to end. I made a coarse attempt of that kind in a blog post a few years ago. Other articles use better methods, and give us new ways to think about form (McGrath et al. 2018, Piper et al. 2023). But how closely does the pace of verbal change correlate with readers’ experience of uncertainty or surprise? We don’t know.

Autoregressive language models offer a tempting new angle on this problem, because they’re trained specifically to predict how a given text will continue. Intuitively, it feels like we could measure the predictability of a plot by first asking a model to continue the story, and then measuring the divergence between predicted continuation and real text. Even if this isn’t exactly how readers form expectations and experience surprise, it might begin to give us some leverage on the question.

Researchers have run a loosely similar experiment on very short stories contributed by experimental subjects (Sap et. al 2020). But scaling that up to published novels poses a challenge. For one thing, language models may not be equally good at imitating every style. A contemporary model’s failure to predict the next sentence by Jane Austen might just mean that it’s bad at channeling the Regency.

So, to factor style out of the question, let’s ask a model to predict what will happen in, say, the next three pages of a story — and then compare those predictions to its own summaries of the pages when it sees them.

Readers of a certain age will recognize this as a game Ernie invites Bert to play on “Sesame Street.”

Ernie asks Bert “what happens next” in this picture. Bert anticipates that the man will step in the pail, and disaster will ensue.

To spell the method out more precisely: we move through a novel roughly 900 words at a time. On each pass, we give a language model both a recap of earlier events, and a new 900-word passage. We ask the model to summarize the new passage, and also ask it to predict what will happen next. Then we compare its prediction to the summary it generates when it actually sees the next passage, and measure cosine distance between the two sentence embeddings. A large distance means the model did a poor job of predicting “what would happen next.”

Does this have any relation to human uncertainty?

I’m not claiming that this is a good model of the way readers experience plot. We don’t have a good model of that yet! The more appropriate question to ask is: Does this correlate at all with anything human readers do?

We can check by asking a reader to do the same thing: read roughly 900-word passages and make predictions about the future. Then we can compare the human reader’s predictions to automatically-generated summaries.

Passages were drawn from Now in November, by Josephine Johnson, and Murder is Dangerous, by Saul Levinson. n = 51 passages, Pearson’s r = .41, p < .01. Human predictions are more variable in quality than the model’s.

When I did this for two novels that were complete blanks to me, my predictions tended to diverge from the actual course of the story in roughly the same places where the model found prediction difficult. So there does seem to be some relationship between a language model’s (in)ability to see what’s coming and a human reader’s.

The image above also reveals that there are broad, consistent differences between books. For both people and models, some stories are easier to predict than others.

A reason not to trust this

Readers of this story may already anticipate the next twist—which is that of course we shouldn’t use LLMs to study uncertainty, because these models have already read many of the books we’re studying and will (presumably) already know the plot.

This is a particularly nasty problem because we don’t have a list of the books commercial models were trained on. We’re flying blind. But before we give up, let’s test how much of a problem this really poses. Researchers at Berkeley have defined a convenient test of the extent to which a model has memorized a book (Chang et al. 2023). In essence, they ask the model to fill in missing names.

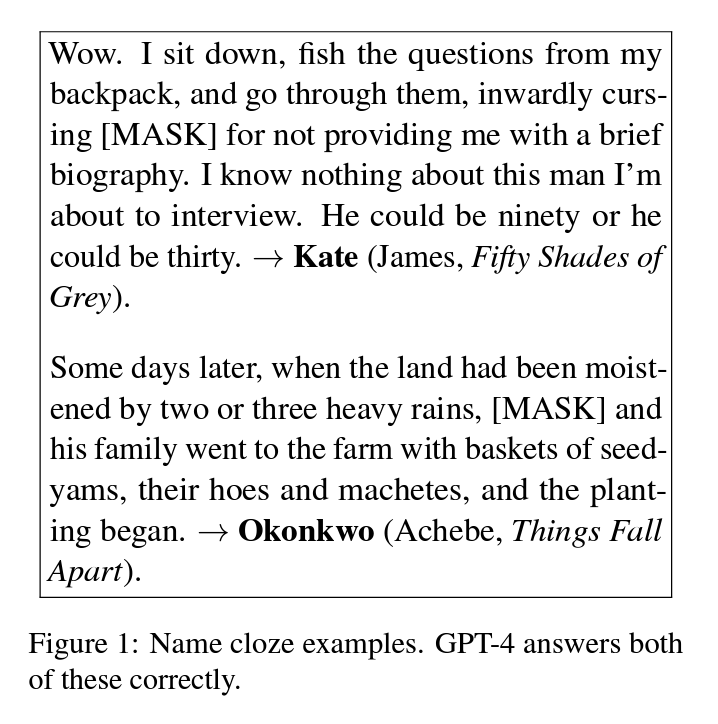
Running this test, Chang et al. find that GPT-4 remembers many books in detail. Moreover, its ability to fill in masked names correlates with its accuracy on certain other tasks—like its ability to estimate date of publication. This could be a problem for questions about plot.

To avoid this problem (and also save money), I’ve been using GPT-3.5, which Chang et al. find is less prone to memorize books. But is that enough to address the problem? Let’s check. Below I’ve plotted the average divergence between prediction and summary for 25 novels on the y axis, and GPT-3.5’s ability to supply masked names in those texts on the x axis. If memorization was making prediction more accurate, we would expect to see a negative correlation: predictions’ divergence from summaries should go down as name_cloze accuracy goes up.

The y axis is average cosine distance between prediction and summary; x axis is GPT-3.5’s accuracy on the name cloze test defined in Chang et al.

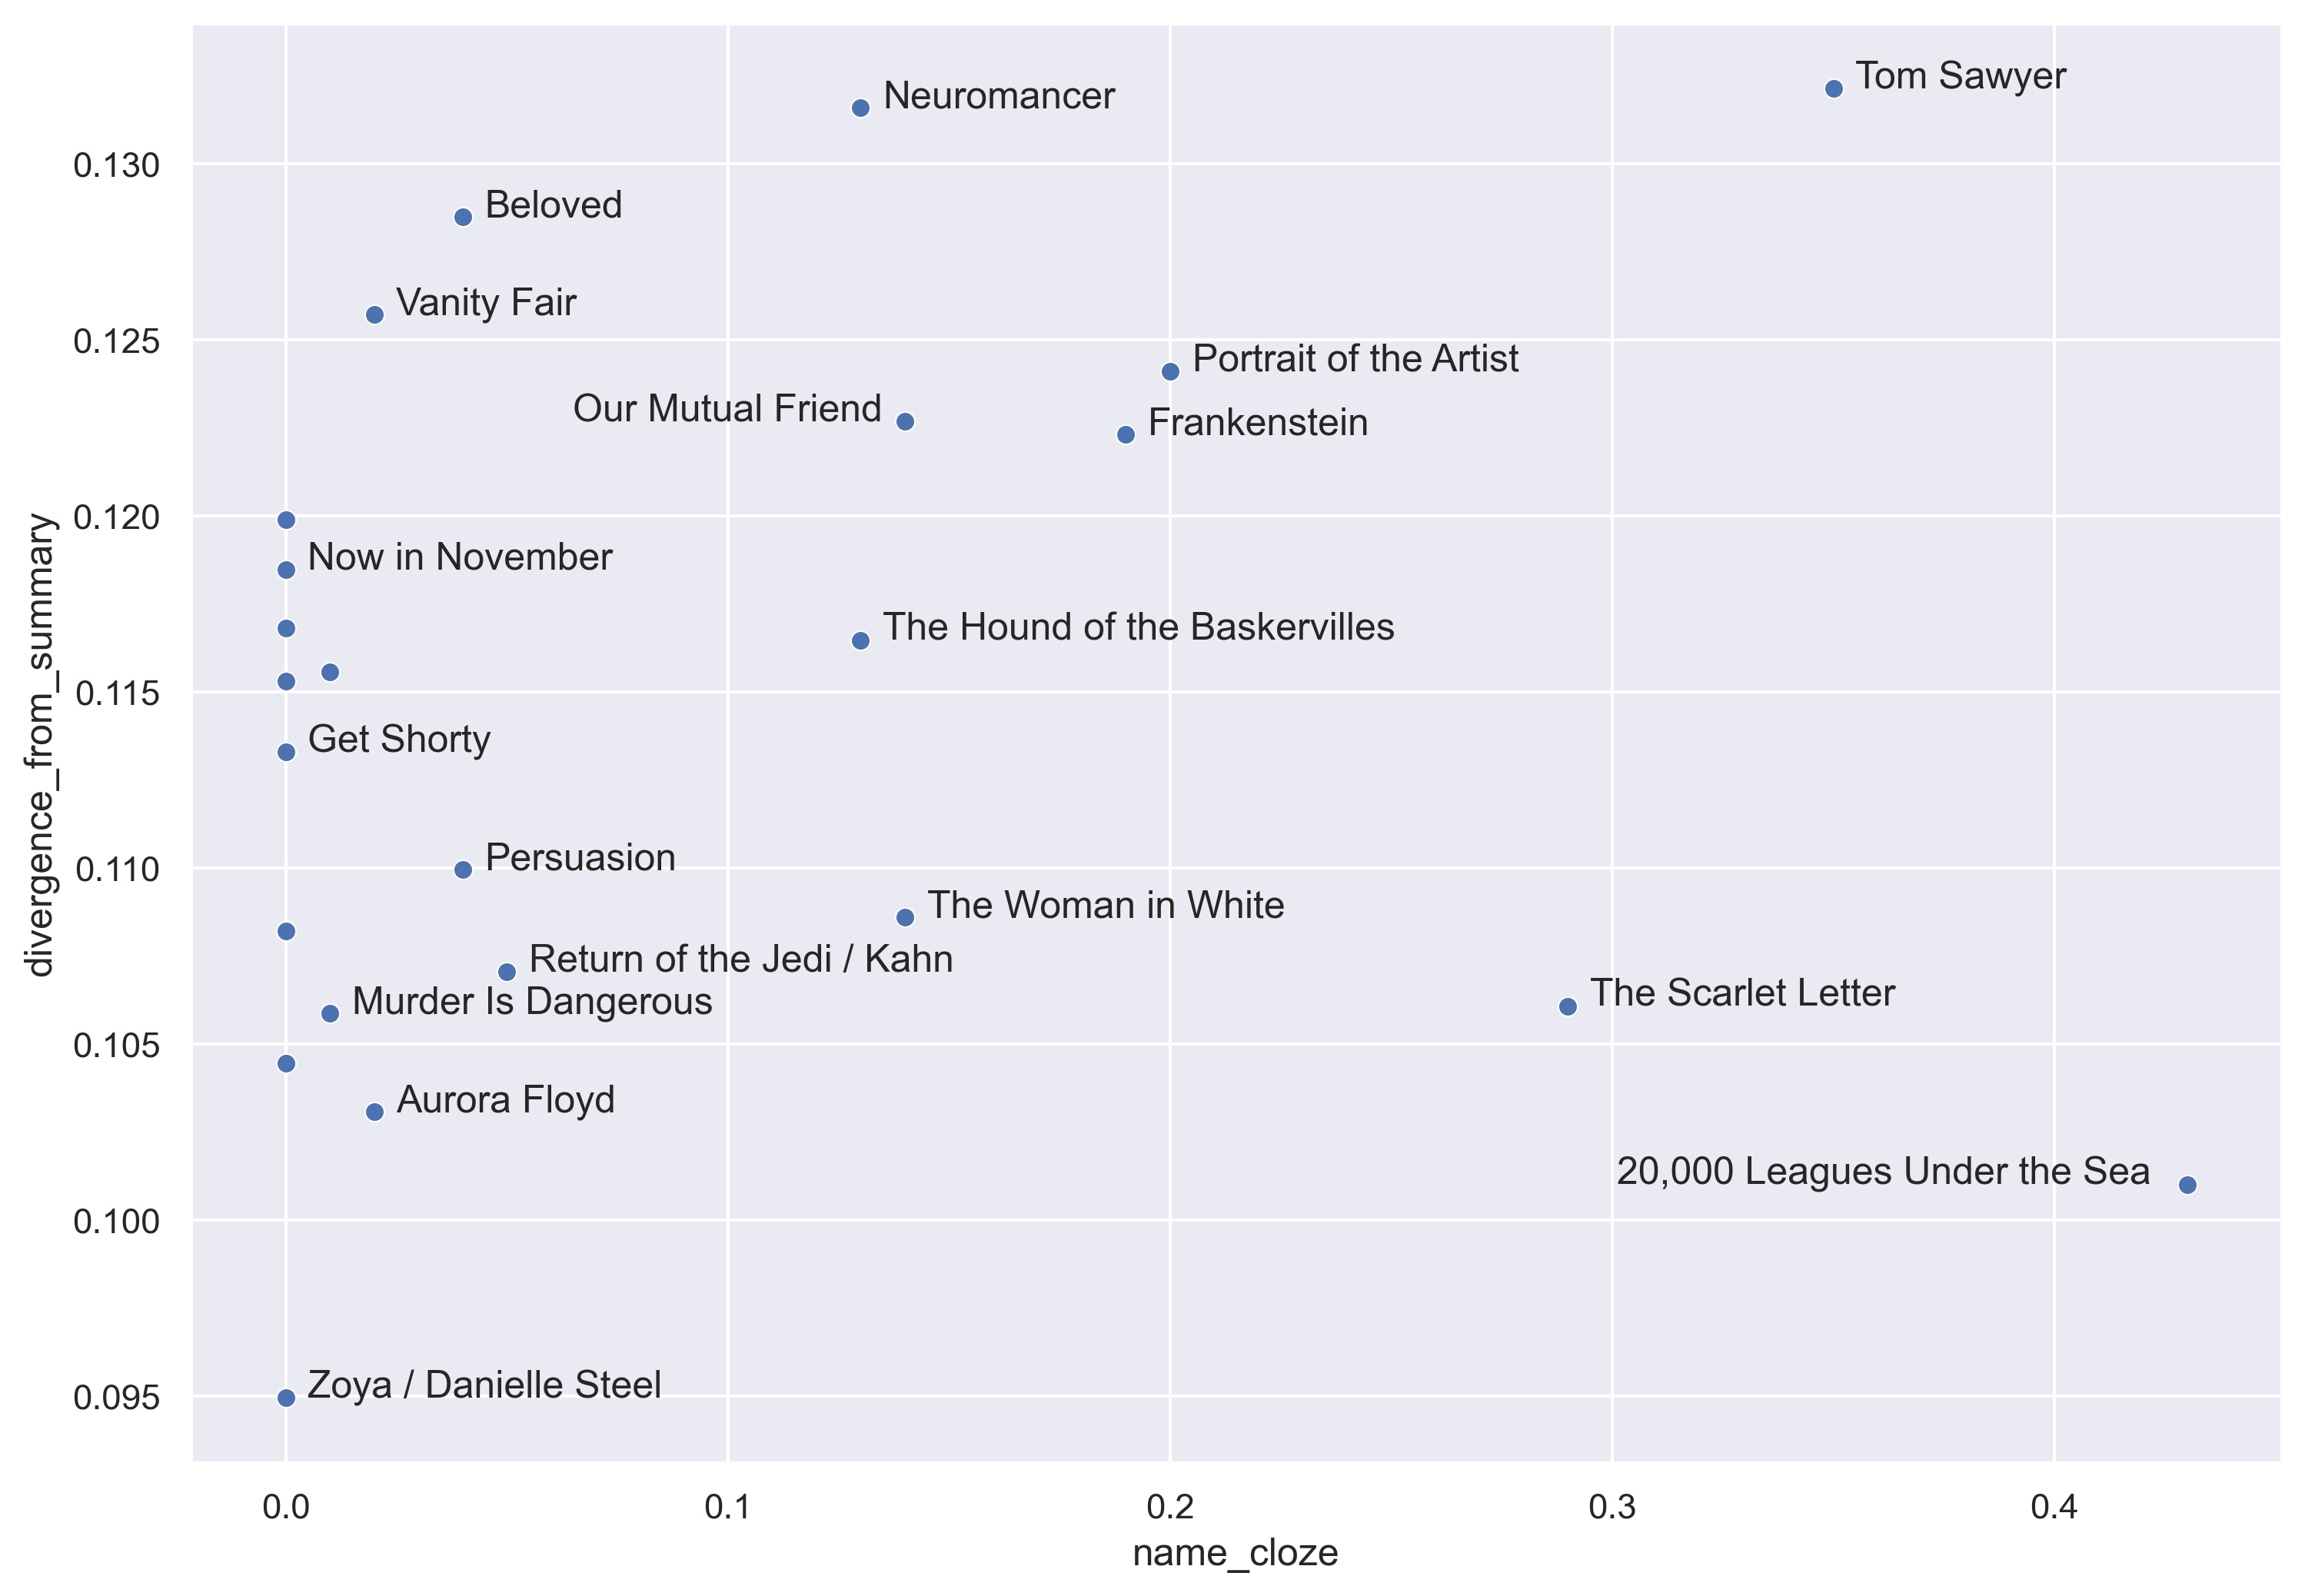
25 books is not enough for a conclusive answer, but so far I cannot measure any pattern of that kind. (If anything, there is a faint trend in the opposite direction.)

In an ideal world, researchers would use language models trained on open data sets that they know and control. But until we get to an ideal world, it looks like it may be possible to run proof-of-concept experiments with things like GPT-3.5, at least if we avoid extremely famous books.

Scrutinizing the image above, readers will probably notice that the most predictable book in this sample was Zoya, by Danielle Steel. Although Steel has a reputation that may encourage disparaging inferences — see Dan Sinykin, Big Fiction, for why — I don’t think we’re in a position to draw those inferences yet. The local rhythms that make prediction possible across three pages are not necessarily what critics mean when they use “predictable” to diss a book.

So what could we learn from predicting the next three pages?

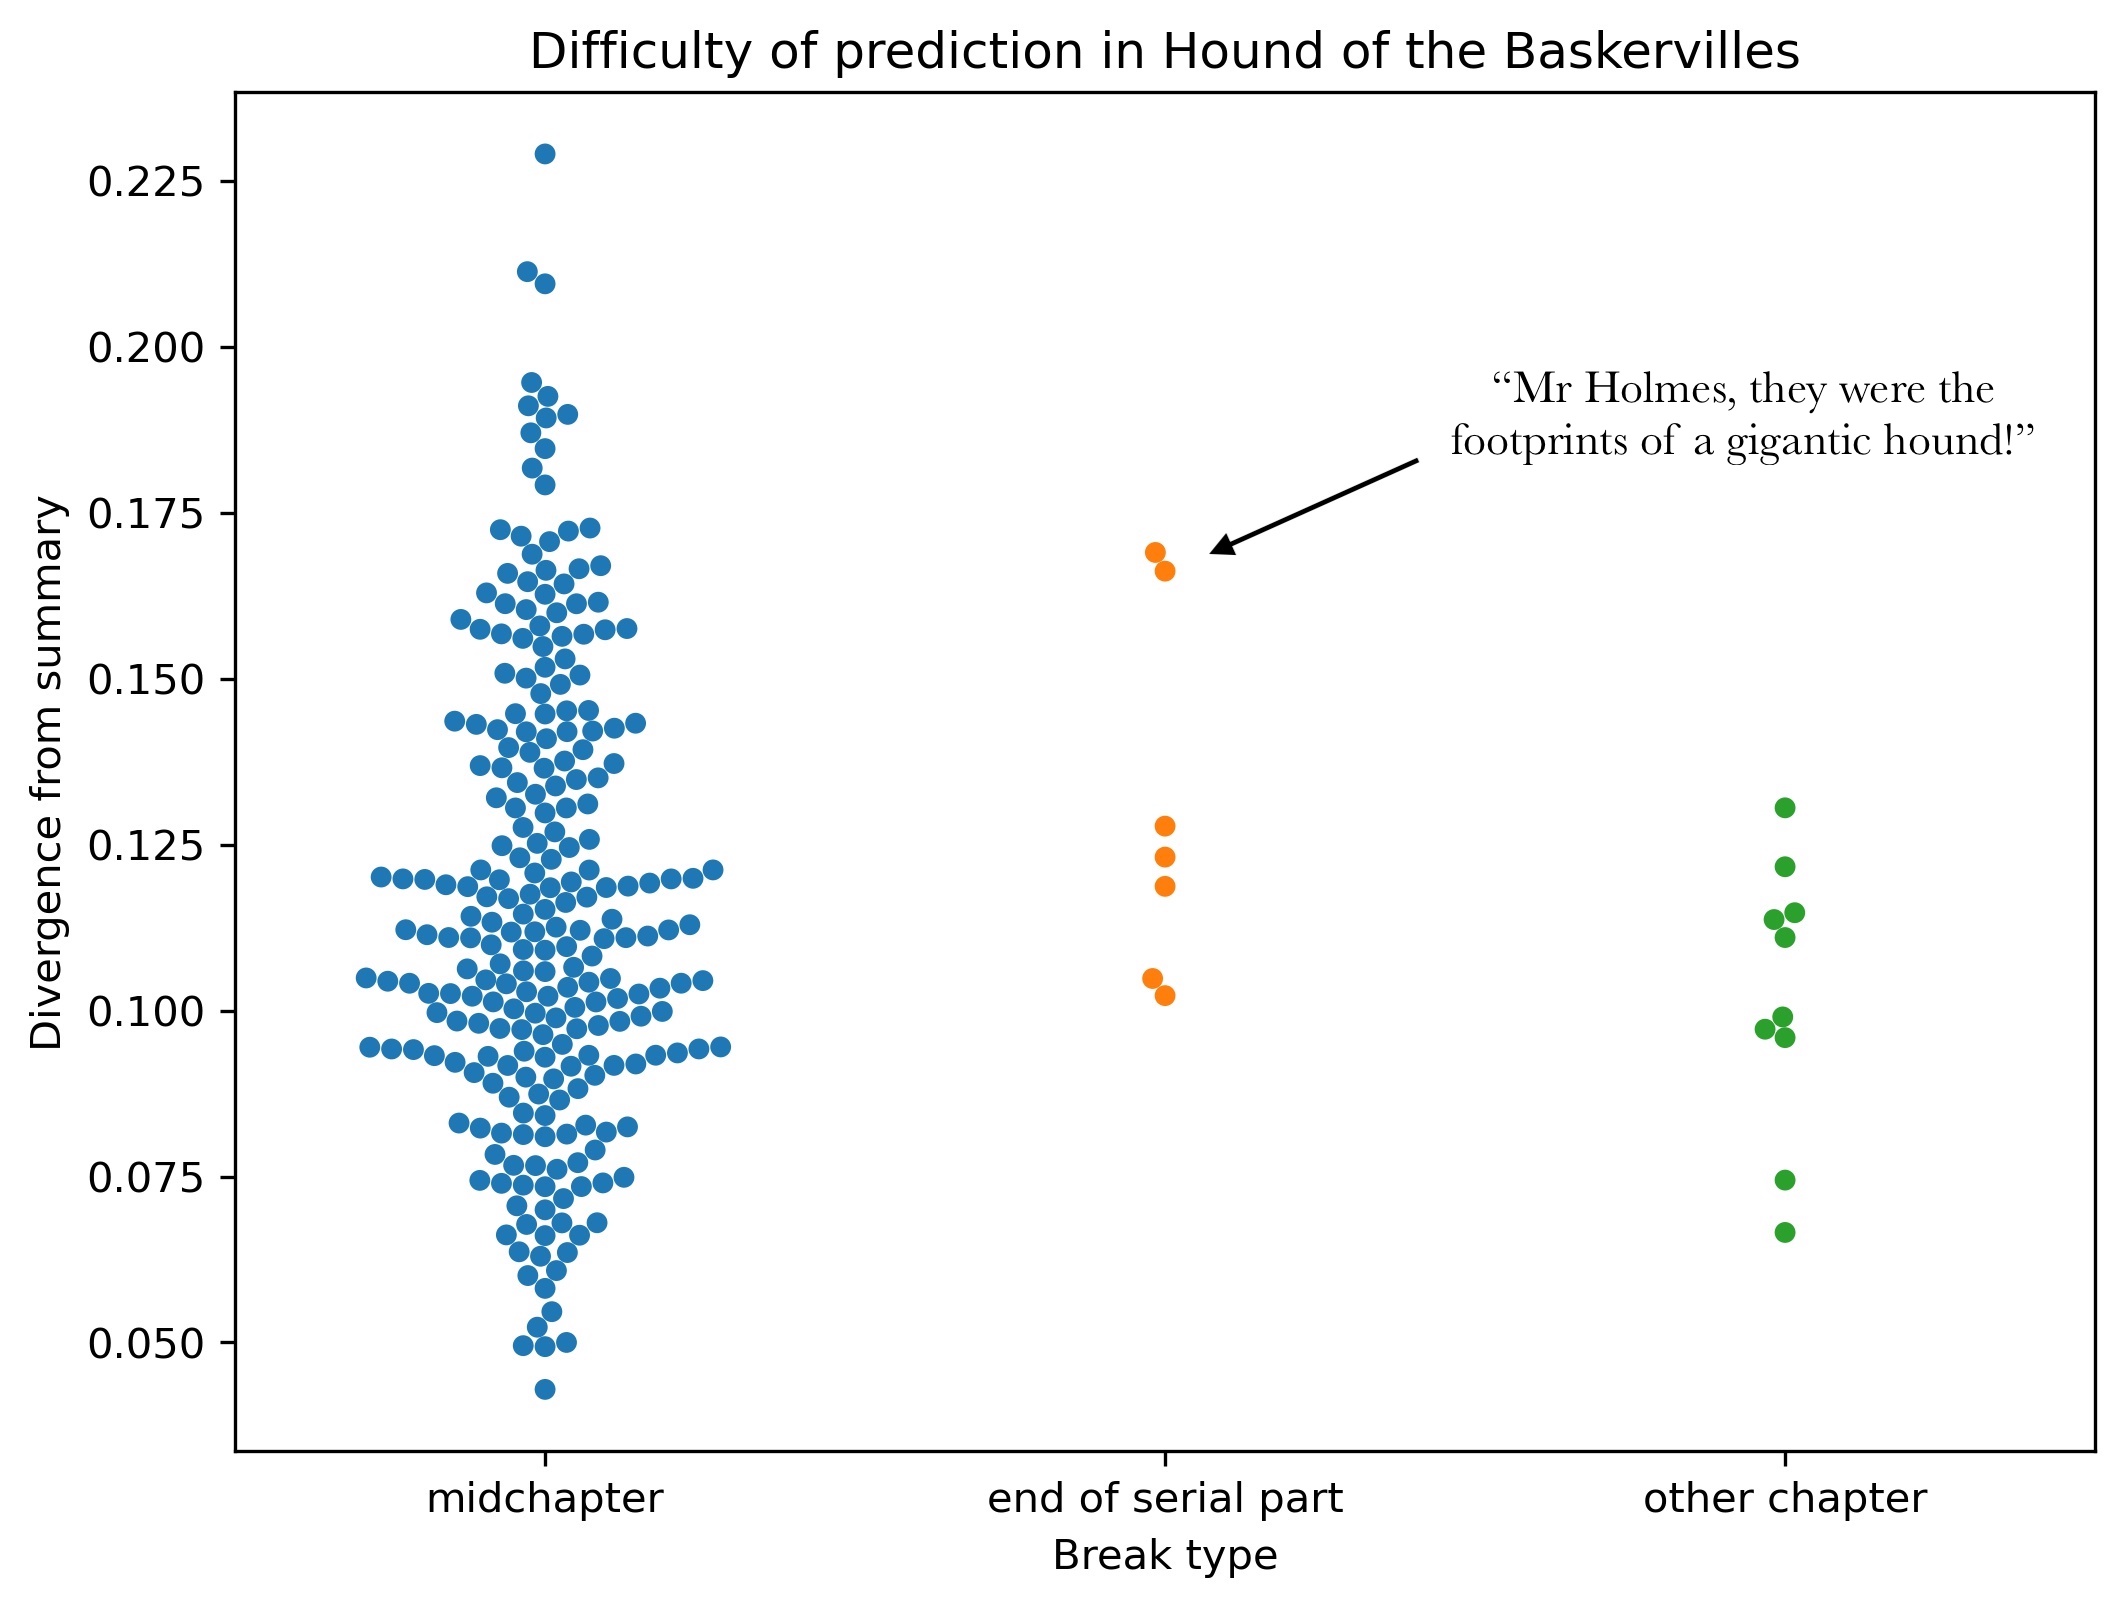
To consider one possible payoff: it might give us a handle on the way chapter-breaks, and other divides, structure the epistemic rhythms of fiction. For instance, many readers have noticed that the installments of novels originally published in magazines tend to end with an explicit mystery to ensure that you keep reading (Haugtvedt 2016 and Beekman 2017). In the first installment of Arthur Conan Doyle’s Hound of the Baskervilles (which covers two chapters), Watson and Holmes learn about a legendary curse that connects the family of the Baskervilles to a fiendish hound. In the final lines of the first installment, Holmes asks the family doctor about footprints found near the body of Sir Charles Baskerville. “A man’s or a woman’s?” Holmes asks. The doctor’s “voice sank almost to a whisper as he answered. ‘Mr Holmes, they were the footprints of a gigantic hound!'” End installment.

Novels don’t have soundtracks. But unexplained, suggestive new information is as good as a sting: “Bum – bum – BUM!”

The Hound of the Baskervilles, by Sidney Paget, 1902.

It appears that we can measure this cliffhanger effect: the serial installments of The Hound of the Baskervilles often end with a moment of heightened mystery — at least, if inability to predict the next three pages is any measure of mystery. When we measure predictive accuracy throughout the story, making four different passes to ensure we have roughly-900-word chunks aligned with all the chapter breaks, we find that predictions are farther from reality at the ends of serial installments. There is no similar effect at other chapter breaks.

The mean for breaks at serial installments is more than one standard deviation above the mean for other chapter-breaks. In spite of tiny n, this is actually p < .05.

Now, this is admittedly a cherry-picked example. So far, I have only looked at seven novels where we can distinguish the ends of serial installments from other kinds of chapter break (using data from Warhol et al). And I don’t see this pattern in all of them.

So I’m not yet making any historical argument about serialization and the rise of the cliffhanger. I’m just suggesting that it’s the kind of question someone could eventually address using this method. A doctoral student could do it, for instance, with a locally hosted model. (I don’t recommend doing it with GPT-3.5, because I dropped $150 or so on this post, and that might add up across a dissertation.) Some initial tests suggest to me that this approach will produce results significantly different than we’re getting with lexical methods.

Since I’m explicitly encouraging people to run with this, let me also say that someone actually writing a paper using this method might want to tinker with several things before trusting it:

  1. Measuring the distance between the embedding of one prediction sentence and one summary sentence is a crude way to measure expectation and surprise. Readers don’t necessarily form a single expectation about plot. Maybe it would be better to model expectation as a range of possibility?
  2. Related to this: models may need to be nudged to speculate and not just predict that current actions will continue.
  3. 900-word chunks may not be the only appropriate scale of analysis. When readers talk about narrative surprise they’re often thinking about larger arcs like “who will he marry?” or “who turns out to be the murderer?”
  4. We need a way to handle braided narratives where each chapter is devoted to a different group of characters (Garrett 1980). In a multi-plot story, the B or C plot will often not continue across a chapter break.

But we’re in a multi-plot narrative ourselves, so those problems may be solved by a different group of characters. This was just a blog post to share an idea and get people arguing about it. Tune in next time, for our thrilling conclusion. (Bum – bum – BUM!)

Code and data used for this post are available on Github.

The ideas discussed here were previously presented in Paris at a workshop on AI for the analysis of literary corpora, and in Copenhagen in a conference on generative methods in the social sciences and humanities. I’d like to thank the organizers of those events, esp. Thierry Poibeau, Anders Munk, and Rolf Lund, for stimulating conversation — and also many people in attendance, especially David Bamman, Lynn Cherny, and Meredith Martin. In writing code to query the OpenAI API, I borrowed snippets from Quinn Dombrowski (and also of course from GPT-4 itself oh brave new world &c). My thinking about 19c serialization was advanced by conversation with David Bishop and Eleanor Courtemanche, and by suggestions from Ryan Cordell and Elizabeth Foxwell on Bluesky.

References

Beekman, G. (2017) “Emotional Density, Suspense, and the Serialization of The Woman in White in All theYear Round.” Victorian Periodicals Review 50.1.

Chang, K., Cramer, M., Soni, S., & Bamman, D. (2023) “Speak, Memory: An Archaeology of Books known to ChatGPT / GPT-4,” https://arxiv.org/abs/2305.00118.

Dames, N. (2023) The Chapter: A Segmented History from Antiquity to the Twenty-First Century. Princeton University Press.

Garrett, P. (1980) The Victorian Multiplot Novel: Studies in Dialogical Form. Yale University Press.

Haugtvedt, E. (2016) “The Sympathy of Suspense: Gaskell and Braddon’s Slow and Fast Sensation Fiction in Family Magazines.” Victorian Periodicals Review 49.1.

McGrath, L., Higgins, D., & Hintze, A. (2018) “Measuring Modernist Novelty.” Journal of Cultural Analytics. https://culturalanalytics.org/article/11030-measuring-modernist-novelty

Piper, A., Xu, H., & Kolaczyk, E. D. (2023) “Modeling Narrative Revelation.” Computational Humanities Research 2023. https://ceur-ws.org/Vol-3558/paper6166.pdf

Sap, M., Horvitz, E., Choi, Y., Smith, N. A., & Pennebaker, J. (2020) “Recollection Versus Imagination: Exploring Human Memory and Cognition via Neural Language Models.” Proceedings of the 58th Annual Meeting of the ACL. https://aclanthology.org/2020.acl-main.178/

Sinykin, Dan. Big Fiction: How Conglomeration Changed the Publishing Industry and American Literature. Columbia University Press, 2023.

Smuts, A. (2009) “The Paradox of Suspense.” Stanford Encyclopedia of Philosophy. https://plato.stanford.edu/entries/paradox-suspense/#SusSur

Tobin, V. (2018) The Elements of Surprise: Our Mental Limits and the Satisfactions of Plot. Harvard University Press.

Warhol, Robyn, et al., “Reading Like a Victorian,” https://readinglikeavictorian.osu.edu/.

Categories
fiction plot unsupervised methods

Why it’s hard for syuzhet to be right or wrong yet.

I’ve enjoyed following the exchange between Matt Jockers, Annie Swafford, Jacob Eisenstein, and Dan Piepenbring about Jockers’ R package syuzhet — designed to illuminate plot by tracing the “emotional valence” of narration across the course of a novel.

I’ve found this a consistently impressive and informative conversation; it has taught me literally everything I know about “low-pass filters.” But I have no idea who is right or wrong.

More fundamentally, I’m unsure how anyone could be right or wrong here, because as far as I can tell there’s no thesis under discussion yet. Jockers’ article isn’t published. All we have is an R package, syuzhet, which does something I would call exploratory data analysis. And it’s hard to evaluate exploratory data analysis in the absence of a specific argument.

For instance, does syuzhet smooth plot arcs appropriately? I don’t know. Without a specific thesis we’re trying to test, how would we decide what scale of variation matters? In some novels it might be a scene-to-scene rhythm; in others it might be a long arc. Until I know what scale of variation matters for a particular question, I have no way of knowing what kind of smoothing is “too much” or “too little.”*

The same thing goes, more fundamentally, for the concepts of “plot” and “emotional valence” themselves. As Jacob Eisenstein has pointed out, these aren’t concepts that have a single agreed-upon meaning. To argue about them meaningfully, we’re going to need a particular historical or formal question we’re trying to solve.

It seems to me likely that syuzhet will usefully illuminate some aspects of plot. But I have no way of knowing which aspects until I look at a test involving groups of books that readers perceive as different in some specific way. For instance, if syuzhet reliably discriminates between books with tragic and comic endings, that would already be interesting. It’s not everything we mean by plot, but it’s one important thing.

The underlying issue here is that Matt hasn’t published his article yet. So we don’t actually have a thesis to debate. What we have is a new form of exploratory data analysis, released as an R package. Conversation about exploration can be interesting; it can teach me a lot about low-pass filters; but I don’t know how it could be wrong or right until I know what the exploration is trying to reveal.

I think this holds even for Matt’s claim that he’s identified six (or seven) fundamental plot patterns. That sounds like a thesis, but I would tend to say it’s still description of exploratory analysis — in this case a clustering process. Matt has done the clustering in a principled and careful way, but clustering is still (in my eyes) basically an exploratory method. I’m not sure how to evaluate it until I know what kind of generic or historical evidence would count as confirmation that we’re looking at a coherent “plot pattern.”

There are a range of ways to get that confirmation. Lynn Cherny has explored plot using supervised methods; if you do that, predictive accuracy gives you an easy test. But unsupervised methods can also be great, in cases where tests aren’t so easy to define; it’s just that an unsupervised method needs to be supplemented by historical or formal discussion that tells you what would count as confirmation for this method. I imagine there will be some of that in Matt’s article, when it comes out.

* [Edit March 31: After playing around with some artificial data myself, I have to acknowledge that the low-pass filter option in syuzhet can behave in unintuitive ways where extreme outliers and edges are involved. I think Annie Swafford (in blog posts) and Daniel Lepage (below) have been right to emphasize this. It could be less of an issue with real data; I had to use pretty extreme outliers to “break” the filter; it’s not actually the case that the whole shape is necessarily defined by its single highest point. But my guess is that this sort of filter would only add value if you wanted to build in a strong prior that plot fluctuates on or near a particular “wavelength.” On the other hand, Matt Jockers has alluded to unpublished evidence for that sort of prior (or at least for a particular filter setting). So, after changing my opinion a couple times, I’m still not feeling I have an answer here.]

Categories
19c discovery strategies fiction plot

“Plot arcs” in the novel.

Ben Schmidt has developed a fascinating way of visualizing “plot arcs” in television series. I’ve been trying to understand how it works, with help from several people on Twitter, and also trying to see if it can reveal anything interesting about novels.

If you haven’t read Ben’s blog post, I recommend exploring it now, because I’m going to skim lightly over some of the details of his method.

cubes

At its core, the technique is not complicated. It hinges on a transformation called principal component analysis (PCA), which allows researchers to map high-dimensional data onto a two-dimensional space, while keeping individual data points as far apart as possible. You can think of PCA as a technique that gives you a “good viewing angle” for flattening out a complex object. For instance, if you’ve got eight points at the corners of a cube, you could represent them as seen in (a), but (b) might be more legible because it spreads the points out more. It does that by squashing several different physical dimensions (length and breadth) into the x axis on the page.

Ben uses this technique to reveal the structural relationship between different parts of a plot. As I understand it, he divides television scripts into six segments of equal length, and trains a topic model on all the segments. If you produce, say, 100 topics, each segment of each show is now characterized as a point in 100-dimensional space, where each dimension measures the prominence of one particular topic.

He takes the first sixth of every show and averages them to produce a single point that represents the average topic distribution for the first-sixth of all shows. After doing that for all six segments, he has six data points that represent typical segments of narrative time. Then he uses PCA to find an abstract space where those points are well separated. When he does this, he gets an arc-like structure that tends to preserve the original narrative sequence of the segments (although the algorithm isn’t directly informed about sequence). In his most detailed visualization, he even takes this down to twelfths.

Benjamin Schmidt's initial visualization of "plot arcs," December 16, 2014.
Benjamin Schmidt’s initial visualization of “plot arcs,” December 16, 2014.

But what does this mean?
From the beginning, Ben has been pretty careful to stress that he sees the parabolic shape of this pattern as an artifact of PCA. (“I should emphasize that it’s hard to imagine any other shape coming out of the PCA algorithm with the inputs I put in.”) David Bamman confirms this, showing that PCA will turn many kinds of sequential data, even random walks, into an arc. The algorithm is also good at inferring sequence: if point 1 influences point 2, and point 2 influences point 3, etc., PCA will tend to preserve their sequential relationship in the projection. (It does this even if you take 1000 different random walks and add them up to produce a composite walk.) So if we believe that the topic distribution in each segment of each story is strongly related to the topic distributions on either side, we would expect PCA to organize the composite segments of all stories in a sequential arc.

That’s sort of cool, but also suggests that the structure we’re seeing is not unique to “plots.” On the other hand, it’s worth noting that the technique does work better on fiction (and television scripts) than on nonfiction. Or, rather, it shows us something different when you apply it to nonfiction.

nonfiction

Here I’ve divided 2000 volumes of nineteenth-century nonfiction into ten parts, trained 200 topics on all 20,000 segments, and then created composite data points that represent the first “tenth,” second “tenth,” and so on, for all the volumes. PCA is still, somewhat remarkably, able to organize these points in the right sequence, but you have to squint a little to call this an arc. The graph is more clearly dominated by a contrast between introductions and body text. I’ve plotted two of the most important organizing topics as vectors; they include a lot of high-level abstractions and metadiscourse, whereas most of the topics in this nonfiction model are as specific as “birds eggs young wings” (and have a much smaller influence on this graph).

It’s important to note that I’m using the page-level metadata I recently described to select nonfiction here, which makes an effort to screen out paratext. (Otherwise we would probably be seeing topics like “table contents” and “index due date”!)

So where does this leave us? I think Lynn Cherny is right to say that with this technique, deviations from an arc are more significant than the arc itself. The slightly arc-like sequence on the right-hand side of the nonfiction graph isn’t telling us much about deep structures organizing nonfiction; it’s telling us mainly that there are continuities in text. But the “1” way over on the left-hand side is revealing a large structural fact: works of nonfiction have prefaces and introductions that can be very different from the rest of the text. Similarly, one of the most interesting aspects of Ben’s post involves the structural differences he finds toward the end between television genres (the difference between beginning and end seems more important for comedies, whereas science fiction is more organized by a contrast between central action and frame). Not a bad result for a historian to generate in his spare time.

Ten points that represent composite "tenths" of 1.981 works of fiction, topic-modeled and projected by PCA. Multivolume works have been joined.
Ten points that represent composite “tenths” of 1.981 works of fiction, topic-modeled and projected by PCA. Multivolume works have been joined.

Also, when I say differences are interesting, I don’t mean that the composite arc Ben saw by averaging all genres was meaningless. The fact that PCA will organize ten segments of 2000 novels into a parabola is not surprising. It would do that even with a random sequence. But in practice we’re not looking at random sequences, so PCA organizes points into a parabola by drawing on actual linguistic gradients that organize narrative time. As Ben has shown in a follow-up post, PCA is able to explain the patterns in television scripts better than it can explain random sequences.

In other words, the differences we’re seeing between beginnings, middles, and ends are real differences. And it’s interesting to see what those differences are. The x and y axes in a PCA projection don’t have simple meanings, because we’ve squashed multiple dimensions into two. But we can understand the space a little better by mapping the influence exerted by different topics.

Vectors that play an especially strong role in organizing the PCA projection of 1,981 nineteenth-century novels.

In this visualization, for instance, topics associated with dialogue (“said am know yes”) tend to move a point up the y axis. They’re more common in the middle of a narrative.

It might also be interesting to compare the way narratives from different authors or genres project into this space.

Each author here is represented by a composite set of ten segments of narrative time, produced by averaging her works.
Each author here is represented by a composite set of ten segments of narrative time, produced by averaging her works. They are projected into a space defined by the average “tenths” of all works in the dataset.

Mary Elizabeth Braddon is a sensation novelist, and her works are strongly organized by a structure that resembles the majority of other novels in the nineteenth century (or is perhaps even more distinct than usual). A book like Lady Audley’s Secret begins with a stage-setting description of domestic space and family relationships. The middle of the book is characterized by dialogue. The tone of the diction becomes progressively more sentimental* until, in the conclusion, we back away from dialogue again to summary (but a summary that is very different from the introduction in tone).

By contrast, the novels of George Eliot are… um, perhaps it would be safest to say “not as well characterized by this model of narrative sequence.” You might be tempted to look at that tangle of lines and infer some kind of cyclic structure, but it would be a bit like reading tea leaves. I know George Eliot’s novels are interesting, but I doubt that squiggle tells me why. (It’s important to remember, for instance, that Eliot’s narrative time looks more orderly and arc-like when projected into a space defined by her own writing.)

Supervised and unsupervised models
In short, I think the method Ben has developed is interesting and worth further exploration, but I also think there are real interpretive challenges here. And the interpretive challenges are not general problems that would arise with any quantitative method: they’re specific to a quirk of this one, which is that it’s poised delicately between strategies of “supervised” and “unsupervised” modeling.

Actually, I’m not sure it’s technically accurate to call PCA a model at all; it’s almost a descriptive statistic (like the mean or standard deviation of a dataset). But the attraction of the technique is a bit like the attraction of unsupervised modeling: you turn it loose on the data and it spontaneously reveals patterns.

There’s nothing at all wrong with that, but the tricky thing here is that by focusing PCA on the temporal sequence within works, we actually give it a very strong bias toward a particular sort of pattern (a sequential arc). Which means we’re actually doing something that’s a bit more supervised than it might appear. It’s more like saying “if you assume narrative time is parabola-shaped, what would be the linguistic vectors organizing that space?”

That may not be a bad question! A lot of critics have assumed that narrative time is loosely shaped like a triangle or pyramid. So this might be a very reasonable starting assumption. But it’s important to understand that we are starting with an assumption, and there are different assumptions you could make. Matt Jockers has a different way of mapping plot — by using sentiment analysis to trace the rising or falling tone of discourse as we move through the narrative. Lynn Cherny has used supervised modeling to identify “exciting” passages in popular novels and then used that as a lever to map rhythms that move, for instance, between dialogue and exposition.

All these approaches are interesting, and potentially valid; I just think it’s important to note that none of them are giving us an unsupervised model of plot. (Even unsupervised models do make assumptions, but I would say a topic model, for instance, is slightly more open-ended than an approach that implicitly maps sequences onto arcs.) There’s nothing wrong with assuming an arc, but there might be some advantage to doing it more explicitly. If I were going to use Ben’s insight to study plot in nineteenth-century novels, I would probably drop PCA and instead train two classifiers to recognize the “ends” and “middles” of narratives. When you do that, you get a result that is actually quite parallel to the one I got by using PCA.

The average probabilities two classifiers assigned to segments from different "tenths" of 1,981 novels. Five-fold crossvalidated, but I didn't rule out the possibility that an author might appear in both the test set and the training set.
The average probabilities two classifiers assigned to segments from different “tenths” of 1,981 novels. Five-fold crossvalidated, but I didn’t rule out the possibility that an author might appear in both the test set and the training set.

But with a predictive model like a classifier, I feel a little more confident in my ability to characterize the strength of the patterns I’m seeing. In this case, for instance, the classifier that recognizes ends was about 62% accurate out of sample. The classifier that recognizes middles was about 61% accurate, and since I counted six out of ten segments of each narrative as “the middle,” that’s not a lot better than random. [Later edit: This was a hasty first pass. Some simple normalization got the classifiers up to 67% and 64%. That signal is probably strong enough for people to do more interesting things with it.]

However, I want to be clear: I don’t think there’s anything wrong with using PCA for this, as long as we realize that it’s surprisingly good at inferring sequence from random walks in high-dimensional space. If plots are “arcs” (as critics have tended to assume), why not make use of that insight to analyze and visualize them? Ben’s post shows us one way to do that. Another thing I take away from this exploration is how amazing Twitter can be, because I couldn’t have fully understood what was going on here without contributions from a lot of different people.

* Re: “the tone of the diction becomes progressively more sentimental:” Matt Wilkens points out that the vectors that characterize endings here have a lot in common with the language that Sara Steger identified as characteristic of 19c sentimental fiction.

Postscript Jan 5: Have to admit I’ve found it hard to stop exploring this method. I ran it on a fiction dataset expanded to 4,000 works, and to 1922, and patterns started to become a little more legible. For instance, when I include more of her works, George Eliot no longer looks as idiosyncratic. It’s also kind of interesting to superimpose plot arcs for three different periods. Here I’ve borrowed Ben’s idea of using PCA so to speak “out-of-sample,” since each of these periods is actually projected into a different space (defined by the other two periods).

Generalized narrative arcs for 4,000 works of fiction from 1700 to 1922. Very few of them are actually before 1800, though.
Generalized narrative arcs for 4,000 works of fiction from 1700 to 1922. In each case we’re plotting ten composite points representing the topic distributions for segments of narrative time, and time moves from left to right. The dataset does include reprints.

The fact that these arcs float upward may confirm something we already knew, which is that fiction tends to move away from “summary” and toward direct presentation of “scene” as historical time passes. But I think the stability of the pattern is also significant. As Ben has shown, there’s no guarantee that you’ll get an arc if you project a dataset into a PCA space defined by a different dataset. The congruence of these three arcs may not quite prove that plot *is* an arc, but it does suggest that linguistic signals of “beginnings,” “middles,” and “ends” remained broadly similar from the early nineteenth century through the early twentieth. If we wanted to confirm that, we could make more direct comparisons, but for exploratory visualization I see how PCA is useful here.