Recently, historians have been trying to understand cultural change by measuring the “distances” that separate texts, songs, or other cultural artifacts. Where distances are large, they infer that change has been rapid. There are many ways to define distance, but one common strategy begins by topic modeling the evidence. Each novel (or song, or political speech) can be represented as a distribution across topics in the model. Then researchers estimate the pace of change by measuring distances between topic distributions.
In 2015, Mauch et al. used this strategy to measure the pace of change in popular music—arguing, for instance, that changes linked to hip-hop were more dramatic than the British invasion. Last year, Barron et al. used a similar strategy to measure the influence of speakers in French Revolutionary debate.
I don’t think topic modeling causes problems in either of the papers I just mentioned. But these methods are so useful that they’re likely to be widely imitated, and I do want to warn interested people about a couple of pitfalls I’ve encountered along the road.
One reason for skepticism will immediately occur to humanists: are human perceptions about difference even roughly proportional to the “distances” between topic distributions? In one case study I examined, the answer turned out to be “yes,” but there are caveats attached. Read the paper if you’re curious.
In this blog post, I’ll explore a simpler and weirder problem. Unless we’re careful about the way we measure “distance,” topic models can warp time. Time may seem to pass more slowly toward the edges of a long topic model, and more rapidly toward its center.
For instance, suppose we want to understand the pace of change in fiction between 1885 and 1984. To make sure that there is exactly the same amount of evidence in each decade, we might randomly select 750 works in each decade, and reduce each work to 10,000 randomly sampled words. We topic-model this corpus. Now, suppose we measure change across every year in the timeline by calculating the average cosine distance between the two previous years and the next two years. So, for instance, we measure change across the year 1911 by taking each work published in 1909 or 1910, and comparing its topic proportions (individually) to every work published in 1912 or 1913. Then we’ll calculate the average of all those distances. The (real) results of this experiment are shown below.

Perhaps we’re excited to discover that the pace of change in fiction peaks around 1930, and declines later in the twentieth century. It fits a theory we have about modernism! Wanting to discover whether the decline continues all the way to the present, we add 25 years more evidence, and create a new topic model covering the century from 1910 to 2009. Then we measure change, once again, by measuring distances between topic distributions. Now we can plot the pace of change measured in two different models. Where they overlap, the two models are covering exactly the same works of fiction. The only difference is that one covers a century (1885-1984) centered at 1935, and the other a century (1910-2009) centered at 1960.

But the two models provide significantly different pictures of the period where they overlap. 1978, which was a period of relatively slow change in the first model, is now a peak of rapid change. On the other hand, 1920, which was a point of relatively rapid change, is now a trough of sluggishness.
Puzzled by this sort of evidence, I discussed this problem with Laure Thompson and David Mimno at Cornell, who suggested that I should run a whole series of models using a moving window on the same underlying evidence. So I slid a 100-year window across the two centuries from 1810 to 2009 in five 25-year steps. The results are shown below; I’ve smoothed the curves a little to make the pattern easier to perceive.

The models don’t agree with each other well at all. You may also notice that all these curves are loosely n-shaped; they peak at the middle and decline toward the edges (although sometimes to an uneven extent). That’s why 1920 showed rapid change in a model centered at 1935, but became a trough of sloth in one centered at 1960. To make the pattern clearer we can directly superimpose all five models and plot them on an x-axis using date relative to the model’s timeline (instead of absolute date).

The pattern is clear: if you measure the pace of change by comparing documents individually, time is going to seem to move faster near the center of the model. I don’t entirely understand why this happens, but I suspect the problem is that topic diversity tends to be higher toward the center of a long timeline. When the modeling process is dividing topics, phenomena at the edges of the timeline may fall just below the threshold to form a distinct topic, because they’re more sparsely represented in the corpus (just by virtue of being near an edge). So phenomena at the center will tend to be described with finer resolution, and distances between pairs of documents will tend to be greater there. (In our conversation about the problem, David Mimno ran a generative simulation that produced loosely similar behavior.)
To confirm that this is the problem, I’ve also measured the average cosine distance, and Kullback-Leibler divergence, between pairs of documents in the same year. You get the same n-shaped pattern seen above. In other words, the problem has nothing to do with rates of change as such; it’s just that all distances tend to be larger toward the center of a topic model than at its edges. The pattern is less clearly n-shaped with KL divergence than with cosine distance, but I’ve seen some evidence that it distorts KL divergence as well.
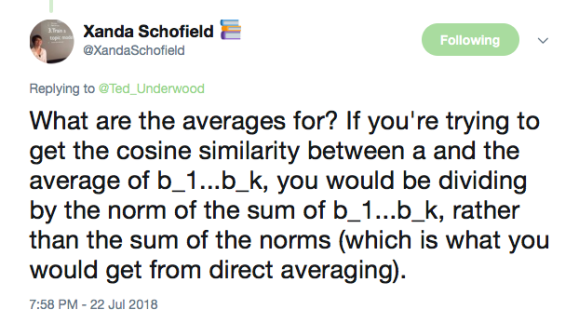
But don’t panic. First, I doubt this is a problem with topic models that cover less than a decade or two. On a sufficiently short timeline, there may be no systematic difference between topics represented at the center and at the edges. Also, this pitfall is easy to avoid if we’re cautious about the way we measure distance. For instance, in the example above I measured cosine distance between individual pairs of documents across a 5-year period, and then averaged all the distances to create an “average pace of change.” Mathematically, that way of averaging things is slighly sketchy, for reasons Xanda Schofield explained on Twitter:

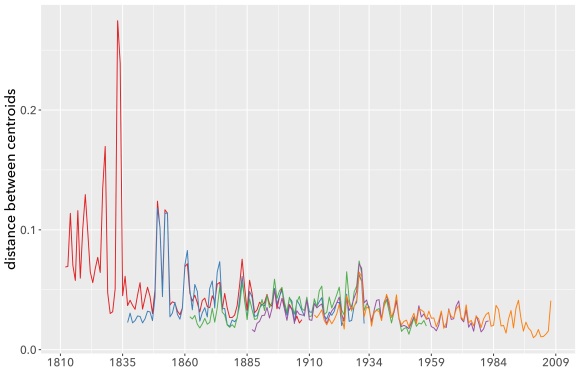
The mathematics of cosine distance tend to work better if you average the documents first, and then measure the cosine between the averages (or “centroids”). If you take that approach—producing yearly centroids and comparing the centroids—the five overlapping models actually agree with each other very well.

Calculating centroids factors out the n-shaped pattern governing average distances between individual books, and focuses on the (smaller) component of distance that is actually year-to-year change. Lines produced this way agree very closely, even about individual years where change seems to accelerate. As substantive literary history, I would take this evidence with a grain of salt: the corpus I’m using is small enough that the apparent peaks could well be produced by accidents of sampling. But the math itself is working.
I’m slightly more confident about the overall decline in the pace of change from the nineteenth century to the twenty-first. Although it doesn’t look huge on this graph, that pattern is statistically quite strong. But I would want to look harder before venturing a literary interpretation. For instance, is this pattern specific to fiction, or does it reflect a broadly shared deceleration in underlying rates of linguistic change? As I argued in a recent paper, supervised models may be better than raw distance measures at answering that culturally-specific question.
But I’m wandering from the topic of this post. The key observation I wanted to share is just that topic models produce a kind of curved space when applied to long timelines; if you’re measuring distances between individual topic distributions, it may not be safe to assume that your yardstick means the same thing at every point in time. This is not a reason for despair: there are lots of good ways to address the distortion. But it’s the kind of thing researchers will want to be aware of.


2 replies on “Do topic models warp time?”
[…] Do topic models warp time? […]
[…] Read the full post here. […]