
Humanists know the subjects we study are complex. So on the rare occasions when we describe them with numbers at all, we tend to proceed cautiously. Maybe too cautiously. Distant readers have spent a lot of time, for instance, just convincing colleagues that it might be okay to use numbers for exploratory purposes.
But the pace of this conversation is not entirely up to us. Outsiders to our disciplines may rush in where we fear to tread, forcing us to confront questions we haven’t faced squarely.
For instance, can we use numbers to identify historical periods when music or literature changed especially rapidly or slowly? Humanists have often used qualitative methods to make that sort of argument. At least since the nineteenth century, our narratives have described periods of stasis separated by paradigm shifts and revolutionary ruptures. For scientists, this raises an obvious, tempting question: why not actually measure rates of change and specify the points on the timeline when ruptures happened?
The highest-profile recent example of this approach is an article in Royal Society Open Science titled “The evolution of popular music” (Mauch et al. 2015). The authors identify three moments of rapid change in US popular music between 1960 and 2010. Moreover, they rank those moments, and argue that the advent of rap caused popular music to change more rapidly than the British Invasion — a claim you may remember, because it got a lot of play in the popular press. Similar arguments have appeared about the pace of change in written expression — e.g, a recent article argues that 1917 was a turning point in political rhetoric (h/t Cameron Blevins).
When disciplinary outsiders make big historical claims, humanists may be tempted just to roll our eyes. But I don’t think this is a kind of intervention we can afford to ignore. Arguments about the pace of cultural change engage theoretical questions that are fundamental to our disciplines, and questions that genuinely fascinate the public. If scientists are posing these questions badly, we need to explain why. On the other hand, if outsiders are addressing important questions with new methods, we need to learn from them. Scholarship is not a struggle between disciplines where the winner is the discipline that repels foreign ideas with greatest determination.
I feel particularly obligated to think this through, because I’ve been arguing for a couple of years that quantitative methods tend to reveal gradual change rather than the sharply periodized plateaus we might like to discover in the past. But maybe I just haven’t been looking closely enough for discontinuities? Recent articles introduce new ways of locating and measuring them.
This blog post applies methods from “The evolution of popular music” to a domain I understand better — nineteenth-century literary history. I’m not making a historical argument yet, just trying to figure out how much weight these new methods could actually support. I hope readers will share their own opinions in the comments. So far I would say I’m skeptical about these methods — or at least skeptical that I know how to interpret them.
How scientists found musical revolutions.
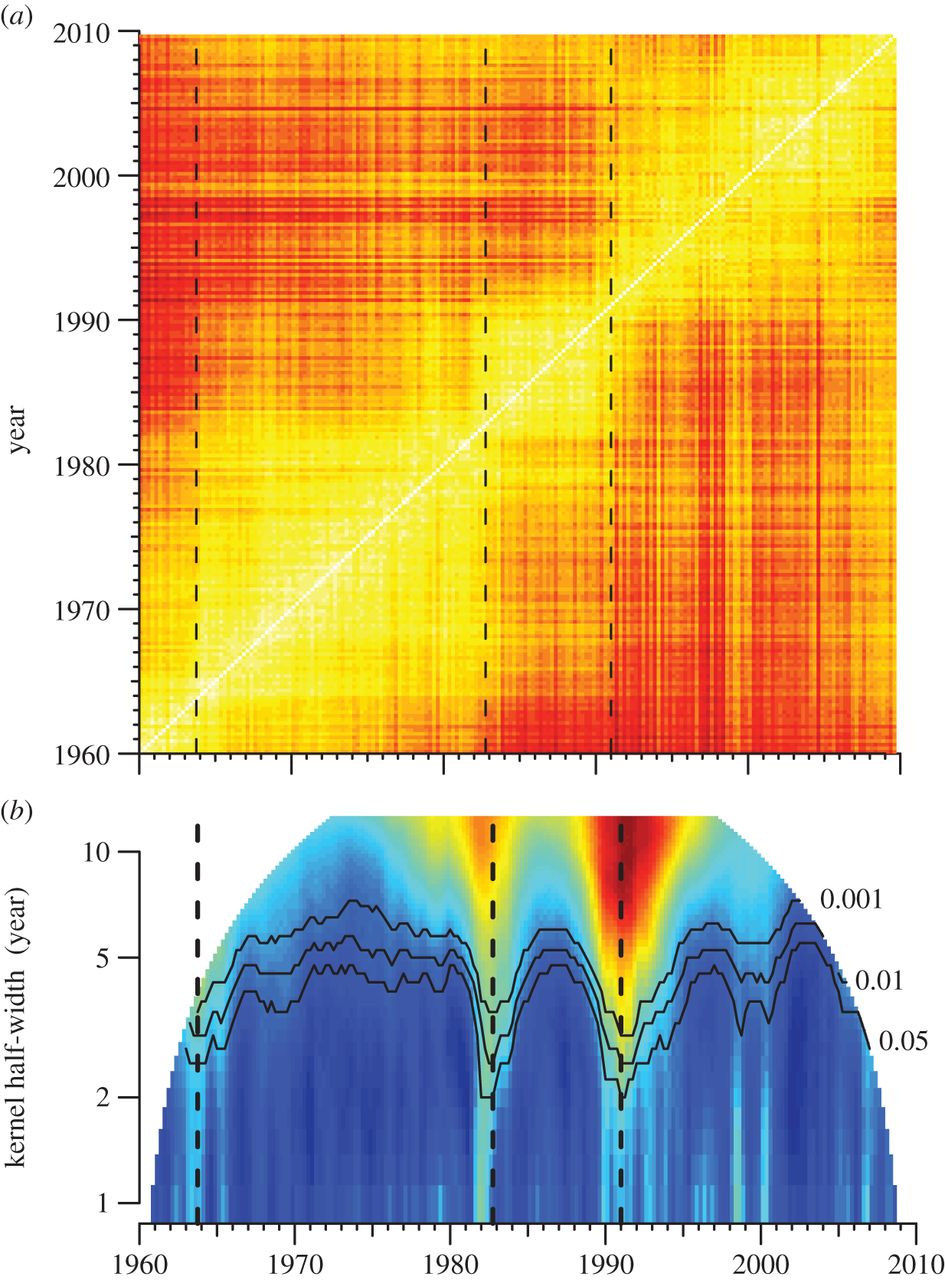
Mauch et al. start by collecting thirty-second snippets of songs in the Billboard Hot 100 between 1960 and 2010. Then they topic-model the collection to identify recurring harmonic and timbral topics. To study historical change, they divide the fifty-year collection into two hundred quarter-year periods, and aggregate the topic frequencies for each quarter. They’re thus able to create a heat map of pairwise “distances” between all these quarter-year periods. This heat map becomes the foundation for the crucial next step in their argument — the calculation of “Foote novelty” that actually identifies revolutionary ruptures in music history.
Trying the same thing on the history of the novel.
Could we do the same thing for the history of fiction? The labor-intensive part would be coming up with a corpus. Nineteenth-century literary scholars don’t have a Billboard Hot 100. We could construct one, but before I spend months crafting a corpus to address this question, I’d like to know whether the question itself is meaningful. So this is a deliberately rough first pass. I’ve created a sample of roughly 1000 novels in a quick and dirty way by randomly selecting 50 male and 50 female authors from each decade 1820-1919 in HathiTrust. Each author is represented in the whole corpus only by a single volume. The corpus covers British and American authors; spelling is normalized to modern British practice. If I were writing an article on this topic I would want a larger dataset and I would definitely want to record things like each author’s year of birth and nationality. This is just a first pass.
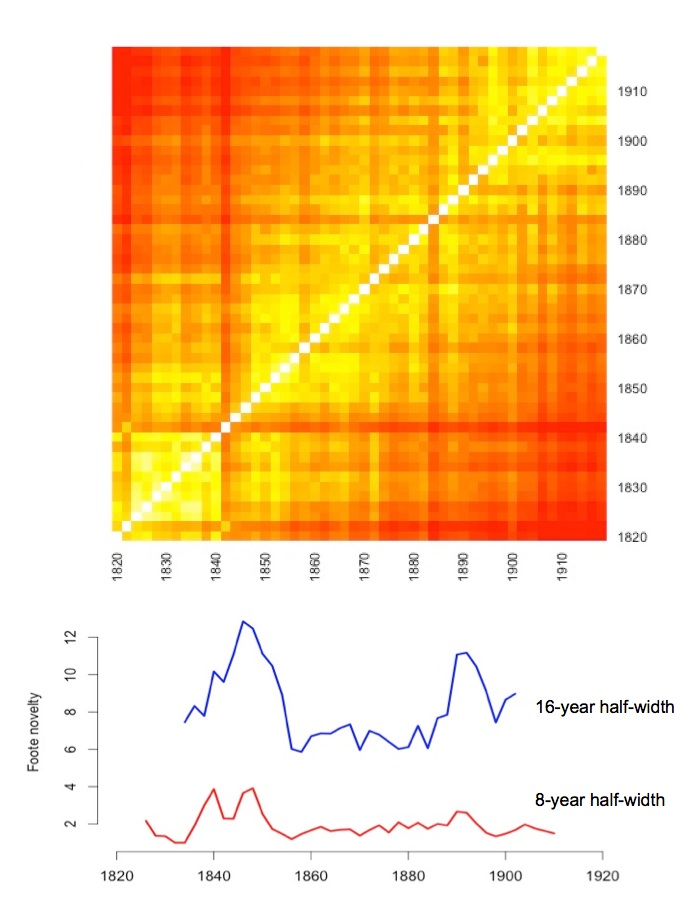
Because this is a longer and sparser sample than Mauch et al. use, we’ll have to compare two-year periods instead of quarters of a year, giving us a coarser picture of change. It’s a simple matter to run a topic model (with 50 topics) and then plot a heat map based on cosine similarities between the topic distributions in each two-year period.
Is any of that true? How would we know? If we just ask whether this story fits our existing preconceptions, I guess we could make it fit reasonably well. As Eleanor Courtemanche pointed out when I discussed this with her, the end of the 1840s is often understood as a moment of transition to realism in British fiction, and the 1890s mark the demise of the three-volume novel. But it’s always easy to assimilate new evidence to our preconceptions. Before we rush to do it, let’s ask whether the quantitative part of this argument has given us any reason at all to believe that the development of English-language fiction really accelerated in the 1840s.
I want to pose four skeptical questions, covering the spectrum from fiddly quantitative details to broad theoretical doubts. I’ll start with the fiddliest part.
1) Is this method robust to different ways of measuring the “distance” between texts?
The short answer is “yes.” The heat maps plotted above are calculated on a topic model, after removing stopwords, but I get very similar results if I compare texts directly, without a topic model, using a range of different distance metrics. Mauch et al. actually apply PCA as well as a topic model; that doesn’t seem to make much difference. The “moments of revolution” stay roughly in the same place.
2) How crucial is the “Foote novelty” piece of the method?
Very crucial, and this is where I think we should start to be skeptical. Mauch et al. are identifying moments of transition using a method that Jonathan Foote developed to segment audio files. The algorithm is designed to find moments of transition, even if those moments are quite subtle. It achieves this by making comparisons — not just between the immediately previous and subsequent moments in a stream of observations — but between all segments of the timeline.
It’s a clever and sensitive method. But there are other, more intuitive ways of thinking about change. For instance, we could take the first ten years of the dataset as a baseline and directly compare the topic distributions in each subsequent novel back to the average distribution in 1820-1829. Here’s the pattern we see if we do that:
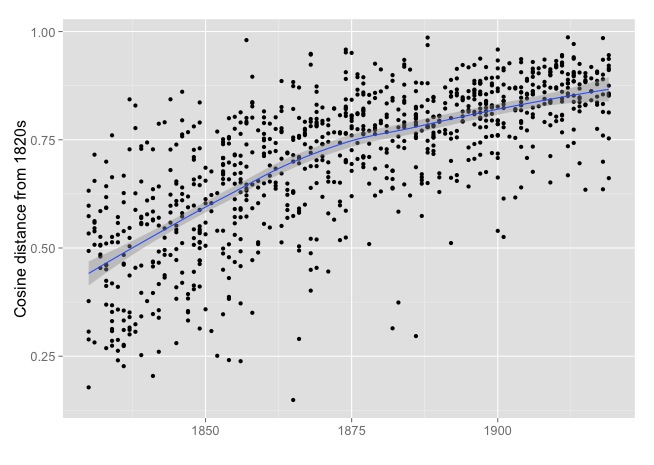 That looks an awful lot like a steady trend; the trend may gradually flatten out (either because change really slows down or, more likely, because cosine distances are bounded at 1.0) but significant spurts of revolutionary novelty are in any case quite difficult to see here.
That made me wonder about the statistical significance of “Foote novelty,” and I’m not satisfied that we know how to assess it. One way to test the statistical significance of a pattern is to randomly permute your data and see how often patterns of the same magnitude turn up. So I repeatedly scrambled the two-year periods I had been comparing, constructed a heat matrix by comparing them pairwise, and calculated Foote novelty.
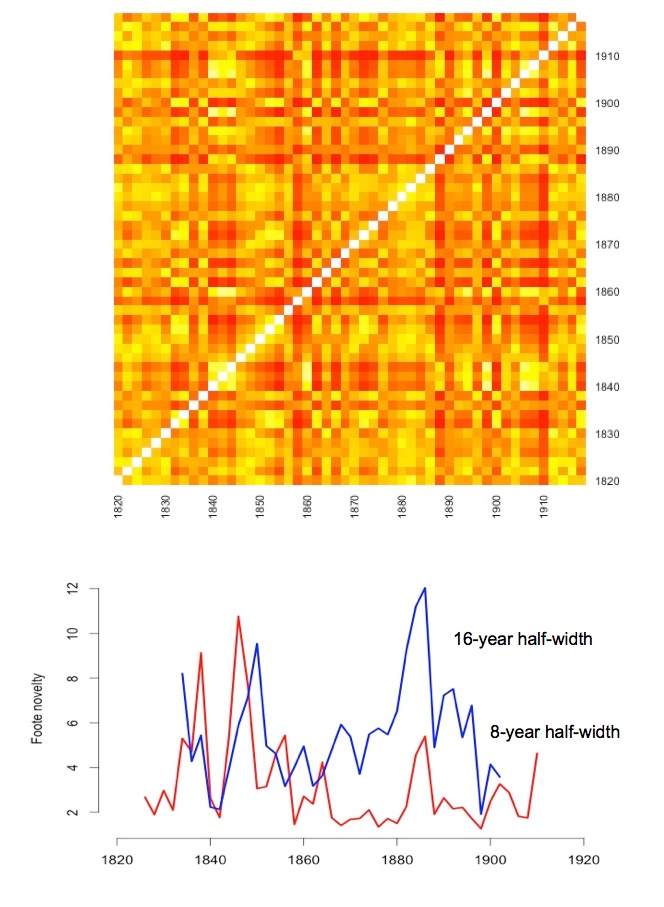
The authors of “The evolution of popular music” also tested significance with a permutation test. They report high levels of significance (p < 0.01) and large effect sizes (they say music changes four to six times faster at the peak of a revolution than at the bottom of a trough). Moreover, they have generously made their data available, in a very full and clearly-organized csv. But when I run my permutation test on their data, I run into the same problem — I keep discovering random Foote novelties that seem as large as the ones in the real data.
It’s possible that I’m making some error, or that we're testing significance differently. I'm permuting the underlying data, which always gives me a matrix that has the checkerboardy look you see above. The symmetrical logic of pairwise comparison still guarantees that random streaks organize themselves in a squarish way, so there are still “pinch points” in the matrix that create high Foote novelties. But the article reports that significance was calculated “by random permutation of the distance matrix.” If I actually scramble the rows or columns of the distance matrix itself I get a completely random pattern that does give me very low Foote novelty scores. But I would never get a pattern like that by calculating pairwise distances in a real dataset, so I haven’t been able to convince myself that it’s an appropriate test.
3) How do we know that all forms of change should carry equal cultural weight?
Now we reach some questions that will make humanists feel more at home. The basic assumption we’re making in the discussion above is that all the features of an expressive medium bear historical significance. If writers replace “love” with “spleen,” or replace “cannot” with “can’t,” it may be more or less equal where this method is concerned. It all potentially counts as change.
This is not to say that all verbal substitutions will carry exactly equal weight. The weight assigned to words can vary a great deal depending on how exactly you measure the distance between texts; topic models, for instance, will tend to treat synonyms as equivalent. But — broadly speaking — things like contractions can still potentially count as literary change, just as instrumentation and timbre count as musical change in “The evolution of popular music.”
At this point a lot of humanists will heave a relieved sigh and say “Well! We know that cultural change doesn’t depend on that kind of merely verbal difference between texts, so I can stop worrying about this whole question.”
Not so fast! I doubt that we know half as much as we think we know about this, and I particularly doubt that we have good reasons to ignore all the kinds of change we’re currently ignoring. Paying attention to merely verbal differences is revealing some massive changes in fiction that previously slipped through our net — like the steady displacement of abstract social judgment by concrete description outlined by Heuser and Le-Khac in LitLab pamphlet #4.
For me, the bottom line is that we know very little about the kinds of change that should, or shouldn’t, count in cultural history. “The evolution of popular music” may move too rapidly to assume that every variation of a waveform bears roughly equal historical significance. But in our daily practice, literary historians rely on a set of assumptions that are much narrower and just as arbitrary. An interesting debate could take place about these questions, once humanists realize what’s at stake, but it’s going to be a thorny debate, and it may not be the only way forward, because …
4) Instead of discussing change in the abstract, we might get further by specifying the particular kinds of change we care about.
Our systems of cultural periodization tend to imply that lots of different aspects of writing (form and style and theme) all change at the same time — when (say) “aestheticism” is replaced by “modernism.” That underlying theory justifies the quest for generalized cultural growth spurts in “The evolution of popular music.”
But we don’t actually have to think about change so generally. We could specify particular social questions that interest us, and measure change relative to those questions.
The advantage of this approach is that you no longer have to start with arbitrary assumptions about the kind of “distance” that counts. Instead you could use social evidence to train a predictive model. Insofar as that model predicts the variables you care about, you know that it’s capturing the specific kind of change that matters for your question.
Jordan Sellers and I took this approach in a working paper we released last spring, modeling the boundary between volumes of poetry that were reviewed in prominent venues, and those that remained obscure. We found that the stylistic signals of poetic prestige remained relatively stable across time, but we also found that they did move, gradually, in a coherent direction. What we didn’t do, in that article, is try to measure the pace of change very precisely. But conceivably you could, using Foote novelty or some other method. Instead of creating a heatmap that represents pairwise distances between texts, you could create a grid where models trained to recognize a social boundary in particular decades make predictions about the same boundary in other decades. If gender ideologies or definitions of poetic prestige do change rapidly in a particular decade, it would show up in the grid, because models trained to predict authorial gender or poetic prominence before that point would become much worse at predicting it afterward.
Conclusion
I haven’t come to any firm conclusion about “The evolution of popular music.” It’s a bold article that proposes and tests important claims; I’ve learned a lot from trying the same thing on literary history. I don’t think I proved that there aren’t any revolutionary growth spurts in the history of the novel. It’s possible (my gut says, even likely) that something does happen around 1848 and around 1890. But I wasn’t able to show that there’s a statistically significant acceleration of change at those moments. More importantly, I haven’t yet been able to convince myself that I know how to measure significance and effect size for Foote novelty at all; so far my attempts to do that produce results that seem different from the results in a paper written by four authors who have more scientific training than I do, so there’s a very good chance that I’m misunderstanding something.
I would welcome comments, because there are a lot of open questions here. The broader task of measuring the pace of cultural change is the kind of genuinely puzzling problem that I hope we’ll be discussing at more length in the IPAM Cultural Analytics workshop next spring at UCLA.
Postscript Oct 5: More will be coming in a day or two. The suggestions I got from comments (below) have helped me think the quantitative part of this through, and I’m working up an iPython notebook that will run reliable tests of significance and effect size for the music data in Mauch et al. as well as a larger corpus of novels. I have become convinced that significance tests on Foote novelty are not a good way to identify moments of rapid change. The basic problem with that approach is that sequential datasets will always have higher Foote novelties than permuted (non-sequential) datasets, if you make the “window” wide enough — even if the pace of change remains constant. Instead, borrowing an idea from Hoyt Long and Richard So, I’m going to use a Chow test to see whether rates of change vary.
Postscript Oct 8: Actually it could be a while before I have more to say about this, because the quantitative part of the problem turns out to be hard. Rates of change definitely vary. Whether they vary significantly, may be a tricky question.
References:
Jonathan Foote. Automatic audio segmentation using a measure of audio novelty. In Proceedings of IEEE International Conference on Multimedia and Expo, vol. I, pp. 452-455, 2000.
Matthias Mauch, Robert M. MacCallum, Mark Levy, Armand M. Leroi. The evolution of popular music. Royal Society Open Science. May 6, 2015.

18 replies on “Can we date revolutions in the history of literature and music?”
From your post: “Instead of creating a heatmap that represents pairwise distances between texts, you could create a grid where models trained to recognize a social boundary in particular decades make predictions about the same boundary in other decades.”
I am reading this as suggesting that you would use predictions that are made about various decades, by models trained on particular decades. But if one is interested in the _pace_ of change (as I think is the case), then shouldn’t this be something more specific, namely: (assuming that the unit of time is a decade), then one should be using the prediction made about each decade by the specific model that has been trained on the *preceding* decade? Maybe that is what you meant, but it wasn’t clear to me from the language.
I am thinking that this would be so for the following reason. If we are interested in the *rate* of change, then we are interested in the second derivative (the d2y/dt), which is given by the slope of the derivative (the dy/dt). So, plotting along the y-axis the *quantum* of the change that takes place in a decade (whose proxy is the discrepancy between: the actual observation for a decade, and the prediction for that decade by a model trained on the preceding decade) seems important.
(Also, cultural changes can in general be non-monotonic — e.g. the famous example of tapered pants giving way to bell-bottoms which in turn give way to tapered pants) and, so, doing it the above way could the best way to prevent that from possibly confounding the plots…)
It’s a good question. I don’t know the answer. This is exactly what’s at stake in deciding whether to use “Foote novelty,” or whether to measure change in more traditional ways. I don’t know which is better.
I think the non-monotonic character of cultural change is exactly why some people might want to consider the grid approach. Suppose you had an example of cyclic change on a roughly decade-long cycle: e.g., suppose poets went back and forth from always rhyming to using about 40% blank (unrhymed) verse, alternating every decade. Change might appear to be very rapid if we just contrasted decade[a] to decade[a+1]. But in a sense, it’s not going anywhere; it’s just a cyclic fashion.
Then suppose there are a string of 4 decades where the prevalence of rhyme in poetry drops 25% a decade, and eventually disappears altogether — 100% unrhymed verse. In a sense this is a more important period of change, but it’s going to look like slower change if we just contrast individual decade[a] to [a+1], because they individually differ by less than 40%.
I’m not sure this is plausible as a historical case, but it’s very plausible as a description of contrasting segments in an audio file, where you do get lots of alternation and repetition. And this is why Foote developed a scheme where you have a grid comparing every segment to every other, and can scan along the diagonal for patterns of variation on a number of different scales.
On a historical scale , a more plausible problem than cyclic fashion is noise. We may be looking at a signal that bounces around quite a lot noisily, and the grid might (conceivably) give us a way of seeing a signal through the noise.
But yes, where measuring effect size is concerned, it would certainly be easier if we could plot a single series of points.
Thanks for this great post. It makes a lot of sense to transfer new methods used in another field and see what they can tell us about our own field and to make them our own rather than leaving the field to others. If entirely agree that if we want computational explorations of literary texts to be done by people with an actual understanding of literature, then we need to try these new methods ourselves and on our own terms, even if we may reject some of them ultimately.
In fact, this post reminded me of something a lot simpler which I tried out some time ago. I would be very interested in your point of view. Here’s what I did: I produced a topic model of a collection of French crime fiction novels published between 1850 and 2010 (a small collection, by your standards, around 250 novels). Because these are not a lot of novels per year, I aggregated the topic scores to decades and then calculated the cumulated differences between topic scores for each pair of subsequent decades. Plotting this along with a 2-degree polynomial as a trend line, periods of more-than-average topic change and periods of less-than-average topic change appeared. The data suggests there is a period of innovation between the 1930s and 1940s and another one when passing from the 1960s to the 1970s. Of course, these two periods coincide with the advent first of the “roman noir” (at the beginning of the 1940s) and then of the “néopolar” (at the beginning of the 1970s), so there may be something to it. Due to the limited amount of data I’m reluctant to place too much confidence on the results, but more fundamentally, of course, the question is whether the method makes sense. Any thoughts?
That sounds like a fascinating project, and I do think the method you describe makes perfect sense quantitatively, with the proviso you mention — that it can be hard to get enough data points to be confident about statistical significance. (But Richard So has recently taught me that something called a “Chow test” can be used to check whether rates of change differ significantly in two different time periods, and you might actually have enough data points for that, if you plot novels individually.)
There’s also the problem I mention in part (3) above — that we probably don’t have consensus yet about the kind of “distance” that matters. Quantitatively-minded scholars can certainly define a general kind of distance based on word counts or topic distributions, but our more traditionally-minded friends may be skeptical that these distances establish a universal metric, or reflect the particular kinds of change they care about.
However, projects like the one you describe could eventually change that. If it turns out that the genre transitions we care about do consistently parallel fluctuations in a generalized “pace of change,” then that will be convincing evidence that generalized distance metrics are after all meaningful.
A hugely important experiment and set of speculations, Ted. The fact that you (like I) started out as a scholar of Romantic period literature is intriguing in this regard, since epochs like Romanticism whose identity is defined as rapid, “revolutionary” change may especially need the corrective of supplementary, perhaps contradictory methods of benchmarking change (or non-change). The questions that Romantics scholars have long, and repeatedly, asked about whether Wordworth’s Lyrical Ballads were really new against the background of umpteen poems/ballads like them is a case in point.
But Romanticism as the “age of revolutions” is a side note to what I want to comment on here. Points 3 and 4 in your “skeptical” questions about the nature of change we are able to detect with the method in your experiment caught my attention. (In general, one of the signature features of your work that I admire the most–here and in plenty of articles, posts, and other work elsewhere–is your careful, disciplined restraint or modesty. It’s usual for the literary critic or theorist to demonstrate a claim and then, unable to resist, overstate, overgeneralize, or overreach in claiming the “insane next big thing”–sort of like if Steve Jobs were a literary critic. As in the case of your skeptical questions here, you instead often walk back claims and gentle them in the cool light of reason. That walk-back process–amazingly, if not insanely, enough–is as illuminating as the march forward.)
Pendant to your points 3 and 4, I’d like to suggest that a general topic for the digital humanities, especially as pertains to quantitative methods, is what kind of change our methods are, and are not, designed to model. (“DH and Cultural Change” would make a great conference or special issue, and would interest a number of the communities in the field that need to be brought together, including DH literary scholars, DH historians, and #transformDH’ers as well as the social-critique part of the new-media-studies community.)
So, my pendant point: I’m worried that quantitative methods based ultimately on bag-of-words statistical frequency approaches (not to mention heat-map smoothing algorithms) put too exclusive a spotlght on a mass-effect, culturomic idea of change (and possibly also on change of a systemic or world-system sort, though we’re not there yet in terms of the corpora evidence or methods). That leaves out of consideration other kinds of change that have been, or are now, taken to be important. One is the Romantic model of change by original genius (and, even older than that, by divine inspiration). That is: the singular data point that turns out to be an agency point–the One (as Neo is called in the Matrix movies) who changes it all. Another is the Lucretian “clinamen” or “swerve” non-agential version of that, whose recent manifestations have been of great interest in many fields (complexity, emergency, contingency theory, etc.).
So, I wonder if we don’t need a fuller methodological framework for using quantitative methods for detecting (and also defining) significant change. Imagine, for instance, that we develop a grid of at least three or four different kinds of methods designed for different understandings of change.
One would be of the sort instanced in your post and many other mass effect, topic modeled, and similar applications of quantitative method (the Heuser and Le-Khac Stanford Literary Lab pamphlet on “word cohorts” that you mention is a case in point).
Another might be a “marker”-based tracking method of the kind used to detect gene mutations in populations under the stress of environmental change. (See an article that is well outside my competence, but that I point to as an example of the methodology involved: Ary A. Hoffmann1 & Yvonne Willi, “Detecting genetic responses to environmental change,” Nature Reviews Genetics 9, 421-432 [June 2008].)
Another might be a network analysis approach–for example, as exemplified in Saket Navlakha and Carl Kingsford’s “Network Archaeology: Uncovering Ancient Networks from Present-Day Interactions,” PLoS Computional Biology 7.4(2011).
Method #3 here might be especially interesting in testing the original genius (aka “mutant”) theory of intellectual change. Not sure what to suggest for modeling complexity theory of historical change, though at the DH conference in Siberia recently I was powerfully struck by the work of Professor Leonid Borodkin of Moscow State University, a digital historian whose work has focused in part on simulations of great historical changes (he demo’d the Russian Revolution) based on complexity/chaos theory modelings of large-scale quantitative data.
–Alan
Thanks very much for this contribution, Alan. And I agree: the quantitative details I wrestle with in the first part of this post matter mostly as a way of highlighting and making concrete some underlying perplexities in our theory of cultural change. As often happens with math, we may think we understand something (“of course heavy objects fall faster”) until we have to specify how much faster, etc.
And you’re right that we need to ask what kinds of change we would in principle be unable to catch with a given set of methods. There are some slow, massive sorts of change that we tend not to notice by reading individual books — but, conversely, there are going to be phenomena that remain in principle invisible on the macro scale. Durably important individual examples, etc. And even as we back out to larger scales, different theories of change would send us looking for different phenomena: e.g. a single population that changes as a whole or intersecting “discourse streams identified as river networks.”
I also think in the long run it’s going to be important to think about a whole spectrum of scales, because a lot of rapid change may turn out to be the eruption of something that developed more slowly in another context. Rap and hip-hop, e.g., weren’t invented in 1991, but that may be the moment when they hit the Billboard Hot 100. I suspect that kind of thing happens a lot.
I know there’s already some good work forthcoming from other people on cultural diffusion. But I do take seriously your suggestion that we might need a conference or special issue on the topic of cultural change. I’ll mull that over, if someone else doesn’t run with it first.
Very innovative stuff, as always, but I can’t help getting nervous every time we layer a new operation on top of the raw textual data. It’s tenuous enough to move from text to topic models, to say nothing of moving from topic models to PCA . . . now from PCA to cosine similarity?!?! Each new transformation relies on the last one having a solid relationship with the raw data, but can we say that here?
In Foote’s case, he can say that, since he’s dealing with a single frequency generated from a single sound wave. His heat maps are designed to model individual sound files, not multiple files, and certainly not topic models. (I think this article is better than the 2000 article for understanding what Foote is doing.) Then again, after some Googling and a quick email to a sound engineer I know, plenty of people think that using Fourier transformations to model a music wave is problematic in and of itself—FFT assumes constant frequency, but even the simplest pop song is going to have constantly varying frequencies. So even Foote’s transformation of a single raw sound wave into frequency similarities, while good enough for some practical applications, needs ample qualification if that transformation is going to be used to make larger claims about cultural evolution.
Anyway, even if you end up ditching Foote novelty, this process of discovering, using, and evaluating different metrics or “algorithms” (God I’m learning to hate that term) is extremely valuable, and it’s a good sign that DH has reached this point. Everyone is moving beyond playing with tools. Who knows, maybe the next step will be to develop our own metrics from scratch!
I agree. I think Foote novelty is very, very dubious for historical material, as I’ll explain at more length in the next post. I also think the topic model and PCA are dispensable; as I mention, I ran the test without them, on raw text, and got the same result. The main reason you might use a topic model here is rhetorical: it might make patterns a little easier to describe and interpret.
Right. Cut out the middle men, if possible. I can’t remember where, but I remember reading an article on calculating cosine similarity straight from tf-idf matrices.
I’m currently trying to replicate and expand the PNAS study (linked in OP) on the State of the Union, and once again, PNAS reveals itself as a less than stellar publication. According to the Supporting Info, the authors ran their analysis on 228 addresses, leaving out only Obama’s 2015 address. But by my count, via UCSB’s SotU archive, there have been 245. The reason for the mismatch seems to be some dubious treatment by Rule et al. of years in which both written and oral messages were delivered to congress (their description of these years doesn’t jive at all with the UCSB archive).
Specifically, it looks like the PNAS study decided not to include the written messages that occurred in the 20th century. I don’t know if that would complicate their results, but that’s still a ~7% reduction in data that goes completely unexplained either in the article or the SI. I’m particularly interested in testing their claim about medium of delivery not affecting content, and now here I discover that they inexplicably jettisoned all the post-19th cenutry written SotU’s in their analysis.
Yeah, written / orally delivered would seem to make a difference for this!
This is really Amazing i must say…
I’m a non-academic..but just for context I have 2 degrees – 1st one in English Lit and other in Library information science: for the past few decades the last discipline does have an area of both research focus and business metrics focus/reality on understanding user search patterns based on heavily searched common concepts/word usage …which includes synonyms drawn from the electronic content management thesauri. It can drive sales patterns, determine deep and breadth of digital content licenses that we must negotiate.
I see this type of work done falling in the similar area. My question is that the quantitative pure analysis should attempt to break through strictly consumer patterns of literature/music. And needs to gauge secondary, tertiary influence on other related works/countries. I mean you are looking at literary revolutions, canons from ….a particular cultural, national context. Romantics in British literary history, etc. vs. its influence on perhaps other national literatures?
I am thinking that this would be so for the following reason. If we are interested in the *rate* of change
I would be wary about drawing conclusions from an attempt to systematise and numerate an art, such as writing. Certainly in my main discipline, history, such efforts have a superficial appeal in terms of the terms by which intellectual contribution to the discipline are measured, but they are always found to be illusory on closer examination. The reason has always been the same: simpliistic or decontexualised post-fact intellectual patterns imposed across a more complex reality.
Can we do it? It will take some effort especially in Africa
Reblogged this on russiainwhichwelive.