Ben Schmidt has developed a fascinating way of visualizing “plot arcs” in television series. I’ve been trying to understand how it works, with help from several people on Twitter, and also trying to see if it can reveal anything interesting about novels.
If you haven’t read Ben’s blog post, I recommend exploring it now, because I’m going to skim lightly over some of the details of his method.
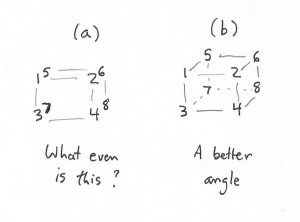
At its core, the technique is not complicated. It hinges on a transformation called principal component analysis (PCA), which allows researchers to map high-dimensional data onto a two-dimensional space, while keeping individual data points as far apart as possible. You can think of PCA as a technique that gives you a “good viewing angle” for flattening out a complex object. For instance, if you’ve got eight points at the corners of a cube, you could represent them as seen in (a), but (b) might be more legible because it spreads the points out more. It does that by squashing several different physical dimensions (length and breadth) into the x axis on the page.
Ben uses this technique to reveal the structural relationship between different parts of a plot. As I understand it, he divides television scripts into six segments of equal length, and trains a topic model on all the segments. If you produce, say, 100 topics, each segment of each show is now characterized as a point in 100-dimensional space, where each dimension measures the prominence of one particular topic.
He takes the first sixth of every show and averages them to produce a single point that represents the average topic distribution for the first-sixth of all shows. After doing that for all six segments, he has six data points that represent typical segments of narrative time. Then he uses PCA to find an abstract space where those points are well separated. When he does this, he gets an arc-like structure that tends to preserve the original narrative sequence of the segments (although the algorithm isn’t directly informed about sequence). In his most detailed visualization, he even takes this down to twelfths.
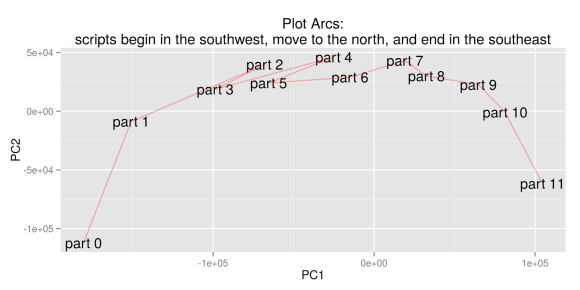
But what does this mean?
From the beginning, Ben has been pretty careful to stress that he sees the parabolic shape of this pattern as an artifact of PCA. (“I should emphasize that it’s hard to imagine any other shape coming out of the PCA algorithm with the inputs I put in.”) David Bamman confirms this, showing that PCA will turn many kinds of sequential data, even random walks, into an arc. The algorithm is also good at inferring sequence: if point 1 influences point 2, and point 2 influences point 3, etc., PCA will tend to preserve their sequential relationship in the projection. (It does this even if you take 1000 different random walks and add them up to produce a composite walk.) So if we believe that the topic distribution in each segment of each story is strongly related to the topic distributions on either side, we would expect PCA to organize the composite segments of all stories in a sequential arc.
That’s sort of cool, but also suggests that the structure we’re seeing is not unique to “plots.” On the other hand, it’s worth noting that the technique does work better on fiction (and television scripts) than on nonfiction. Or, rather, it shows us something different when you apply it to nonfiction.
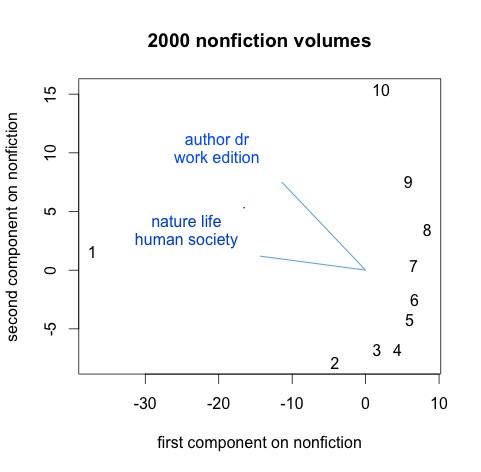
Here I’ve divided 2000 volumes of nineteenth-century nonfiction into ten parts, trained 200 topics on all 20,000 segments, and then created composite data points that represent the first “tenth,” second “tenth,” and so on, for all the volumes. PCA is still, somewhat remarkably, able to organize these points in the right sequence, but you have to squint a little to call this an arc. The graph is more clearly dominated by a contrast between introductions and body text. I’ve plotted two of the most important organizing topics as vectors; they include a lot of high-level abstractions and metadiscourse, whereas most of the topics in this nonfiction model are as specific as “birds eggs young wings” (and have a much smaller influence on this graph).
It’s important to note that I’m using the page-level metadata I recently described to select nonfiction here, which makes an effort to screen out paratext. (Otherwise we would probably be seeing topics like “table contents” and “index due date”!)
So where does this leave us? I think Lynn Cherny is right to say that with this technique, deviations from an arc are more significant than the arc itself. The slightly arc-like sequence on the right-hand side of the nonfiction graph isn’t telling us much about deep structures organizing nonfiction; it’s telling us mainly that there are continuities in text. But the “1” way over on the left-hand side is revealing a large structural fact: works of nonfiction have prefaces and introductions that can be very different from the rest of the text. Similarly, one of the most interesting aspects of Ben’s post involves the structural differences he finds toward the end between television genres (the difference between beginning and end seems more important for comedies, whereas science fiction is more organized by a contrast between central action and frame). Not a bad result for a historian to generate in his spare time.
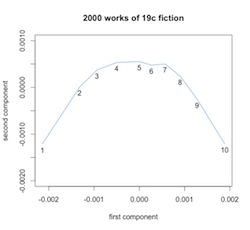
Also, when I say differences are interesting, I don’t mean that the composite arc Ben saw by averaging all genres was meaningless. The fact that PCA will organize ten segments of 2000 novels into a parabola is not surprising. It would do that even with a random sequence. But in practice we’re not looking at random sequences, so PCA organizes points into a parabola by drawing on actual linguistic gradients that organize narrative time. As Ben has shown in a follow-up post, PCA is able to explain the patterns in television scripts better than it can explain random sequences.
In other words, the differences we’re seeing between beginnings, middles, and ends are real differences. And it’s interesting to see what those differences are. The x and y axes in a PCA projection don’t have simple meanings, because we’ve squashed multiple dimensions into two. But we can understand the space a little better by mapping the influence exerted by different topics.
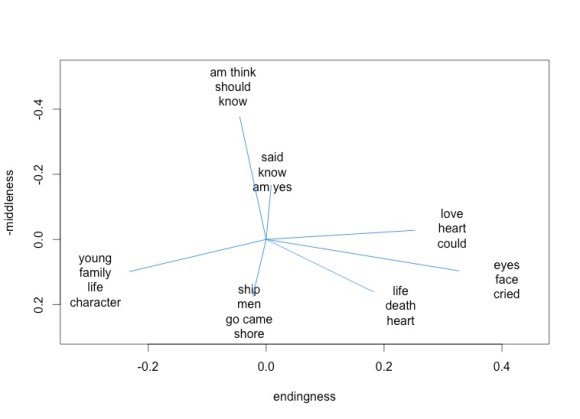
In this visualization, for instance, topics associated with dialogue (“said am know yes”) tend to move a point up the y axis. They’re more common in the middle of a narrative.
It might also be interesting to compare the way narratives from different authors or genres project into this space.
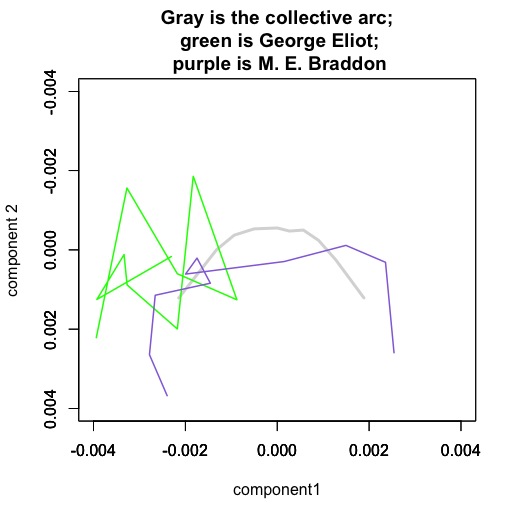
Mary Elizabeth Braddon is a sensation novelist, and her works are strongly organized by a structure that resembles the majority of other novels in the nineteenth century (or is perhaps even more distinct than usual). A book like Lady Audley’s Secret begins with a stage-setting description of domestic space and family relationships. The middle of the book is characterized by dialogue. The tone of the diction becomes progressively more sentimental* until, in the conclusion, we back away from dialogue again to summary (but a summary that is very different from the introduction in tone).
By contrast, the novels of George Eliot are… um, perhaps it would be safest to say “not as well characterized by this model of narrative sequence.” You might be tempted to look at that tangle of lines and infer some kind of cyclic structure, but it would be a bit like reading tea leaves. I know George Eliot’s novels are interesting, but I doubt that squiggle tells me why. (It’s important to remember, for instance, that Eliot’s narrative time looks more orderly and arc-like when projected into a space defined by her own writing.)
Supervised and unsupervised models
In short, I think the method Ben has developed is interesting and worth further exploration, but I also think there are real interpretive challenges here. And the interpretive challenges are not general problems that would arise with any quantitative method: they’re specific to a quirk of this one, which is that it’s poised delicately between strategies of “supervised” and “unsupervised” modeling.
Actually, I’m not sure it’s technically accurate to call PCA a model at all; it’s almost a descriptive statistic (like the mean or standard deviation of a dataset). But the attraction of the technique is a bit like the attraction of unsupervised modeling: you turn it loose on the data and it spontaneously reveals patterns.
There’s nothing at all wrong with that, but the tricky thing here is that by focusing PCA on the temporal sequence within works, we actually give it a very strong bias toward a particular sort of pattern (a sequential arc). Which means we’re actually doing something that’s a bit more supervised than it might appear. It’s more like saying “if you assume narrative time is parabola-shaped, what would be the linguistic vectors organizing that space?”
That may not be a bad question! A lot of critics have assumed that narrative time is loosely shaped like a triangle or pyramid. So this might be a very reasonable starting assumption. But it’s important to understand that we are starting with an assumption, and there are different assumptions you could make. Matt Jockers has a different way of mapping plot — by using sentiment analysis to trace the rising or falling tone of discourse as we move through the narrative. Lynn Cherny has used supervised modeling to identify “exciting” passages in popular novels and then used that as a lever to map rhythms that move, for instance, between dialogue and exposition.
All these approaches are interesting, and potentially valid; I just think it’s important to note that none of them are giving us an unsupervised model of plot. (Even unsupervised models do make assumptions, but I would say a topic model, for instance, is slightly more open-ended than an approach that implicitly maps sequences onto arcs.) There’s nothing wrong with assuming an arc, but there might be some advantage to doing it more explicitly. If I were going to use Ben’s insight to study plot in nineteenth-century novels, I would probably drop PCA and instead train two classifiers to recognize the “ends” and “middles” of narratives. When you do that, you get a result that is actually quite parallel to the one I got by using PCA.
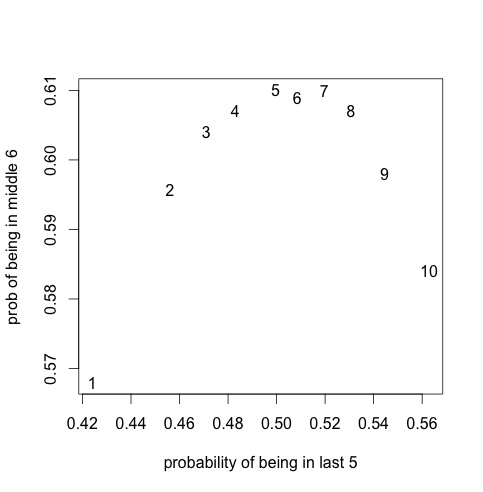
But with a predictive model like a classifier, I feel a little more confident in my ability to characterize the strength of the patterns I’m seeing. In this case, for instance, the classifier that recognizes ends was about 62% accurate out of sample. The classifier that recognizes middles was about 61% accurate, and since I counted six out of ten segments of each narrative as “the middle,” that’s not a lot better than random. [Later edit: This was a hasty first pass. Some simple normalization got the classifiers up to 67% and 64%. That signal is probably strong enough for people to do more interesting things with it.]
However, I want to be clear: I don’t think there’s anything wrong with using PCA for this, as long as we realize that it’s surprisingly good at inferring sequence from random walks in high-dimensional space. If plots are “arcs” (as critics have tended to assume), why not make use of that insight to analyze and visualize them? Ben’s post shows us one way to do that. Another thing I take away from this exploration is how amazing Twitter can be, because I couldn’t have fully understood what was going on here without contributions from a lot of different people.
* Re: “the tone of the diction becomes progressively more sentimental:” Matt Wilkens points out that the vectors that characterize endings here have a lot in common with the language that Sara Steger identified as characteristic of 19c sentimental fiction.
Postscript Jan 5: Have to admit I’ve found it hard to stop exploring this method. I ran it on a fiction dataset expanded to 4,000 works, and to 1922, and patterns started to become a little more legible. For instance, when I include more of her works, George Eliot no longer looks as idiosyncratic. It’s also kind of interesting to superimpose plot arcs for three different periods. Here I’ve borrowed Ben’s idea of using PCA so to speak “out-of-sample,” since each of these periods is actually projected into a different space (defined by the other two periods).
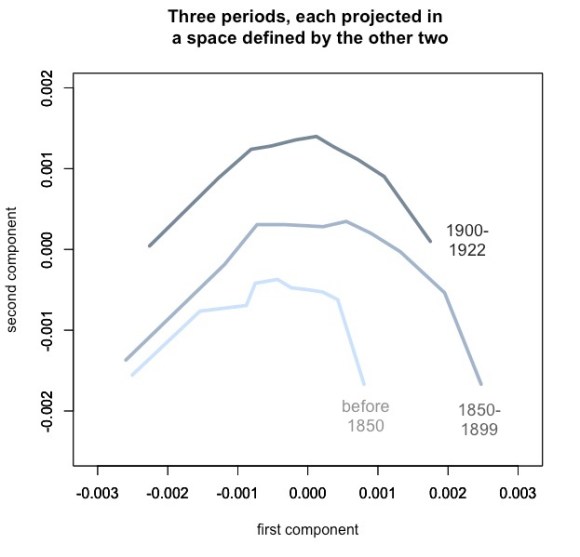
The fact that these arcs float upward may confirm something we already knew, which is that fiction tends to move away from “summary” and toward direct presentation of “scene” as historical time passes. But I think the stability of the pattern is also significant. As Ben has shown, there’s no guarantee that you’ll get an arc if you project a dataset into a PCA space defined by a different dataset. The congruence of these three arcs may not quite prove that plot *is* an arc, but it does suggest that linguistic signals of “beginnings,” “middles,” and “ends” remained broadly similar from the early nineteenth century through the early twentieth. If we wanted to confirm that, we could make more direct comparisons, but for exploratory visualization I see how PCA is useful here.

8 replies on ““Plot arcs” in the novel.”
Thanks for doing this, it’s incredibly helpful. I have a whole bunch of things to say, which is probably good it’s off Twitter for the time being.
1. I would disagree about this straddling supervised and unsupervised. I think this is actually classic unsupervised learning; it only feels like supervised learning because the definition of a text (“all first tenths of all novels”) is much less conventional than the definition of a text in something like topic models. But that’s prior to the model, not part of it. It does have biases, like all unsupervised learning. Just as LDA assumes that tokens are pulled from direchlet topics, PCA assumes that data is organized along multiple orthogonal axes. By restricting the sample to only the six (or twelve, or whatever) documents, it’s pretty likely that the dimensions will be non-interfering resonances. This is a niggling point.
2. I agree that classificatory and comparison approaches make just as much sense—when I first tackled this problem, it was with Dunning Log-Likelihood comparing beginnings to ends and middles to the rest. I have an intuition, which I’m not able to back up yet, that there are advantages to staying in a pure vector space for yet further transformations–particularly in terms of modeling the trajectories as vectors themselves that can be compared. (For this, it doesn’t actually matter that the PCAs are curved, just that they together explain 96% of the variance in the data–I’ve elaborated that in the post on scree plots you link to, and another one here.). That is to say, just since it’s not “technically accurate to call PCA a model at all,” it perhaps provides a better starting point for further explorations in this space.
3. There is probably a better way than PCA to describe “following a second-degree polynomial in multidimensional space,” and that might be a more useful approach for describing if plot arcs are “real.” (Although I’m pretty sure that the answer to that is, “no, to a slightly greater degree than topics in topic models are not real.”)
Perhaps polynomial regression might work for the mission you’re describing in #3 here. But actually your scree plots are already convincing me that the “arc” is in fact a good model (at least a good model for the majority of narratives we’re currently looking at). And that’s a nice thing to know. If you can say, “an arc explains more variance than a straight line when you’re modeling linguistic change across narrative time,” — well, it may confirm critical intuitions, but they’re pretty important intuitions to have confirmed!
On the other hand … it’s possible that higher-order polynomials always explain more variance, so maybe the comparison I’m suggesting there isn’t actually very meaningful. In any event, the arc seems to be a good model.
Just realized that polynomials probably won’t work b/c I’m in a set that allows massive over fitting. I don’t believe this overfits in a bad way bc of out of sample performance, but a polynomial would. On a phone, more to say later.
Erez Aiden left a comment on my original post relevant to the out of sample reprojection you’ve added here. I haven’t digested it yet, but it might be helpful.
Thanks. I think his critique is mostly addressing a question that I actually wrote a lot about for this post — and then deleted — which is “Is this structure what critics *mean* by plot?”
My answer was going to be “No, but I’m not sure it has to matter.” For instance, when critics talk about plot they’re really talking about relations between events, which of course aren’t captured here. Also, a single novel could (often does) have multiple interlacing plots. By “plot,” critics really don’t mean a set of linguistic or topical gradients that organize the contrast between beginning, middle, and end — for one thing, because we don’t realize such gradients exist! So, basically, I think what you’re doing is fascinating precisely *because* it doesn’t map in a straightforward way onto our received understanding of the concept “plot.”
But that raises some broader methodological questions. Maybe material for another post.
[…] original post examining plot “arcs” in TV shows using PCA, there have been posts by Ted Underwood and Matthew Jockers looking at novels, as well as a new piece in LLC that tries to identify plot […]
[…] original post examining plot “arcs” in TV shows using PCA, there have been posts by Ted Underwood and Matthew Jockers looking at novels, as well as a new piece in LLC that tries to identify plot […]